A data flow graph is a composable processing pipeline that transforms data as it moves between sources and destinations. A standard data flow follows a fixed enrich, filter, map sequence. A data flow graph lets you chain transforms in any order, branch into parallel paths, and aggregate data over time windows.
This article walks through creating a data flow graph step by step. For an overview of data flow graphs and the available transforms, see Data flow graphs overview.
Important
Data flow graphs currently support only MQTT, Kafka, and OpenTelemetry endpoints. Other endpoint types like Data Lake, Microsoft Fabric OneLake, Azure Data Explorer, and Local Storage aren't supported. For more information, see Known issues.
Prerequisites
Create a data flow graph
A data flow graph contains three types of elements: sources that bring data in, transforms that process it, and destinations that send it out. Connect them in the order you want data to flow.
In the Operations experience, go to your Azure IoT Operations instance.
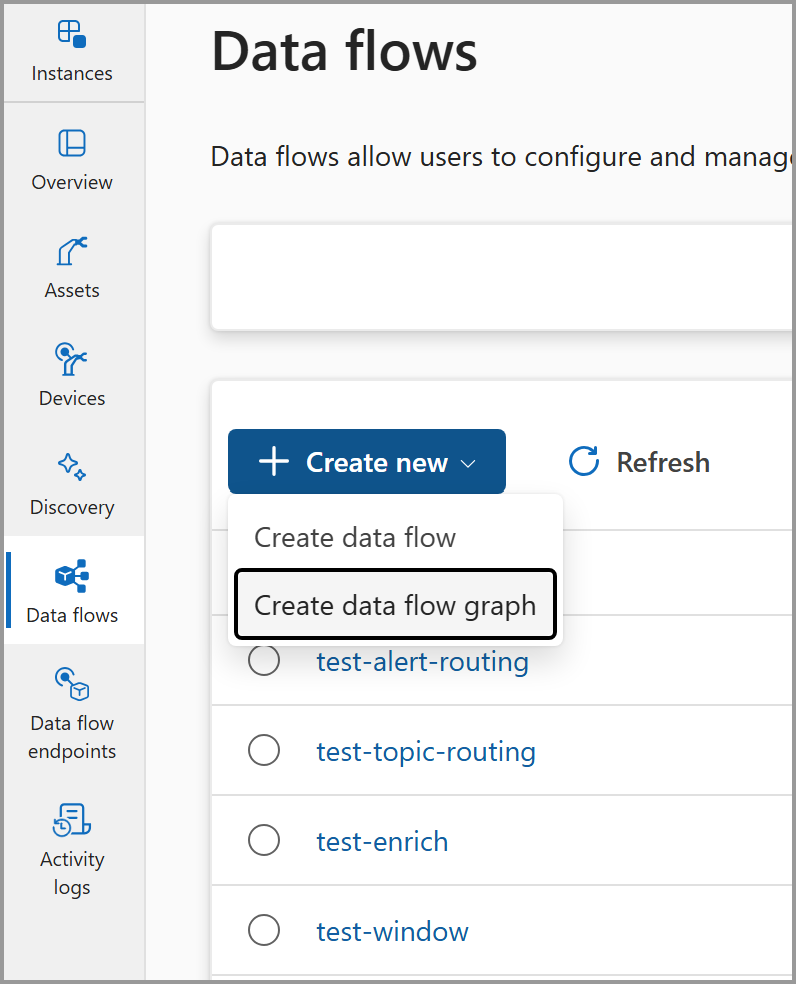
Select Data flow graph > Create data flow graph.
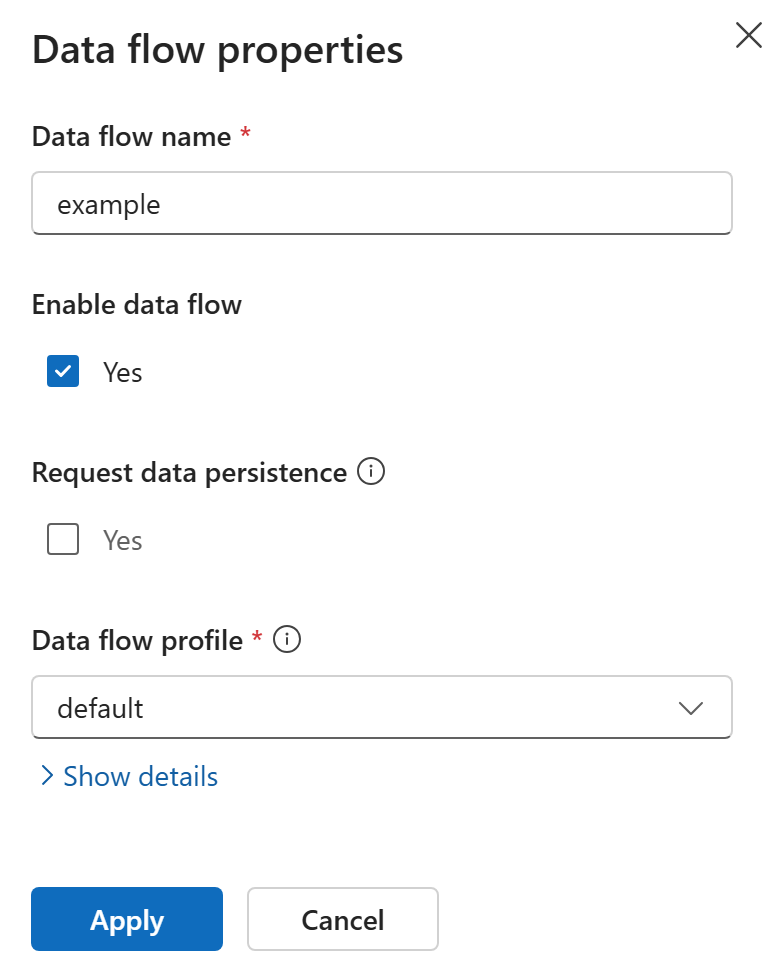
Enter a name for the data flow graph and select a data flow profile. The default profile is selected by default.
Build your pipeline by adding elements to the canvas:
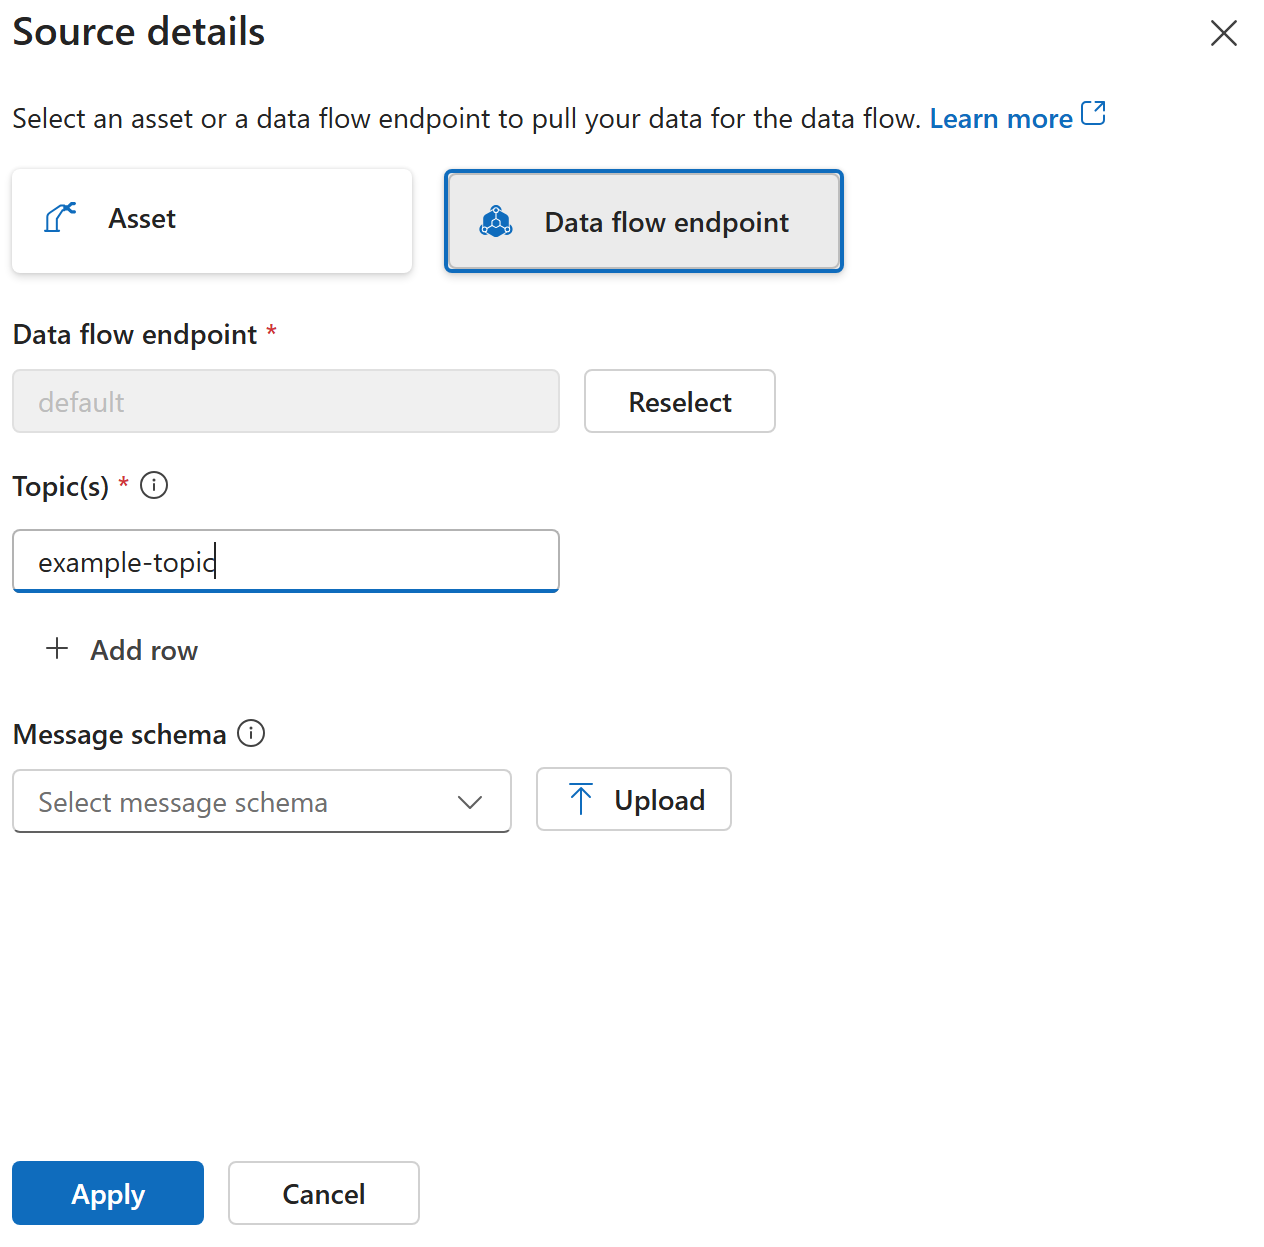
Add a source: Select the source endpoint and configure the topics to subscribe to for incoming messages.
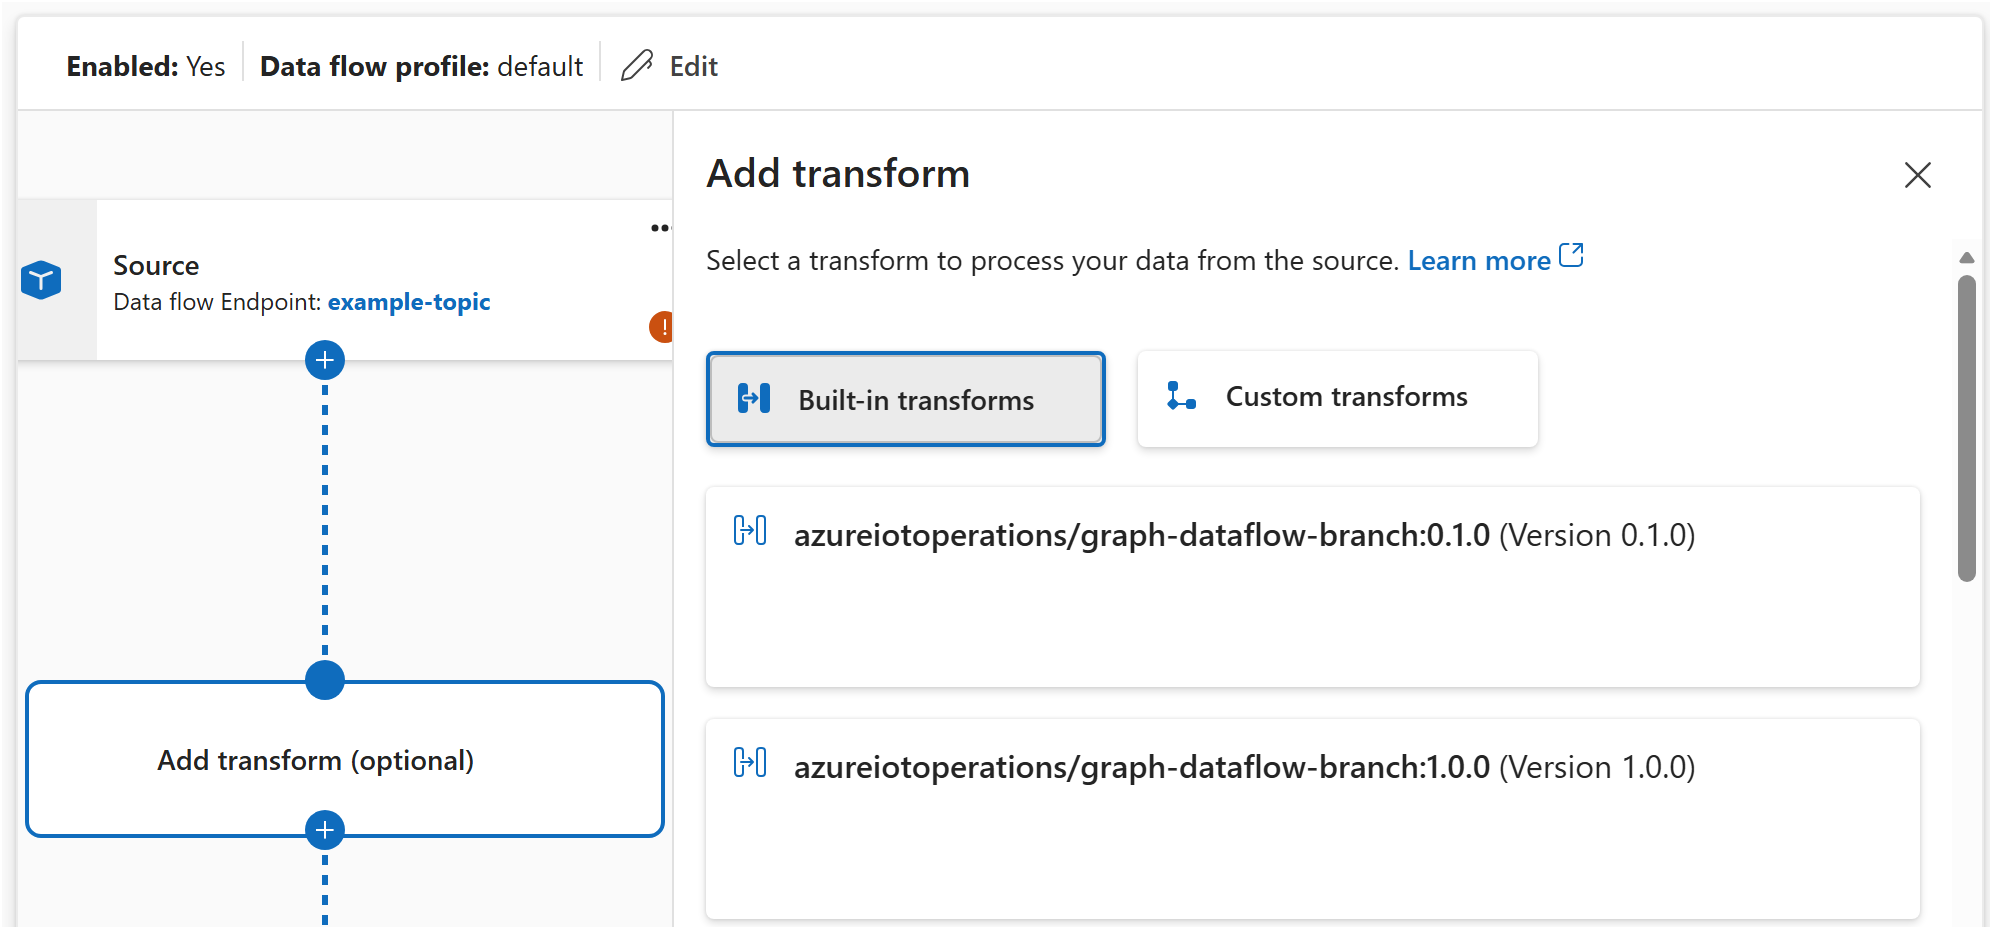
- Add transforms: Select one or more transforms to process the data. Available transforms include map, filter, branch, concatenate, and window. For details on each transform type, see Data flow graphs overview.
Add a destination: Select the destination endpoint and configure the topic or path to send processed data to.

Connect the elements in the order you want data to flow.

Select Save to deploy the data flow graph.
Create a Bicep .bicep file with the following structure. This example creates a data flow graph that reads temperature data, converts it to Fahrenheit, and sends it to a destination topic.
param aioInstanceName string = '<AIO_INSTANCE_NAME>'
param customLocationName string = '<CUSTOM_LOCATION_NAME>'

resource aioInstance 'Microsoft.IoTOperations/instances@2025-10-01' existing = {
  name: aioInstanceName
}

resource customLocation 'Microsoft.ExtendedLocation/customLocations@2021-08-31-preview' existing = {
  name: customLocationName
}

resource defaultDataflowProfile 'Microsoft.IoTOperations/instances/dataflowProfiles@2025-10-01' existing = {
  parent: aioInstance
  name: 'default'
}

resource dataflowGraph 'Microsoft.IoTOperations/instances/dataflowProfiles/dataflowGraphs@2025-10-01' = {
  parent: defaultDataflowProfile
  name: 'temperature-processing'
  extendedLocation: {
    name: customLocation.id
    type: 'CustomLocation'
  }
  properties: {
    profileRef: 'default'
    mode: 'Enabled'
    nodes: [
      {
        nodeType: 'Source'
        name: 'sensors'
        sourceSettings: {
          endpointRef: 'default'
          dataSources: [
            'telemetry/temperature'
          ]
        }
      }
      {
        nodeType: 'Graph'
        name: 'convert'
        graphSettings: {
          registryEndpointRef: 'default'
          artifact: 'azureiotoperations/graph-dataflow-map:1.0.0'
          configuration: [
            {
              key: 'rules'
              value: '{"map":[{"inputs":["*"],"output":"*"},{"inputs":["temperature"],"output":"temperature_f","expression":"cToF($1)"}]}'
            }
          ]
        }
      }
      {
        nodeType: 'Destination'
        name: 'output'
        destinationSettings: {
          endpointRef: 'default'
          dataDestination: 'telemetry/converted'
        }
      }
    ]
    nodeConnections: [
      {
        from: { name: 'sensors' }
        to: { name: 'convert' }
      }
      {
        from: { name: 'convert' }
        to: { name: 'output' }
      }
    ]
  }
}
Deploy the Bicep file:
az deployment group create --resource-group <RESOURCE_GROUP> --template-file <FILE>.bicep
Important
The use of Kubernetes deployment manifests isn't supported in production environments and should only be used for debugging and testing.
Create a Kubernetes manifest .yaml file with the following structure. This example creates a data flow graph that reads temperature data, converts it to Fahrenheit, and sends it to a destination topic.
apiVersion: connectivity.iotoperations.azure.com/v1
kind: DataflowGraph
metadata:
  name: temperature-processing
  namespace: azure-iot-operations
spec:
  profileRef: default
  nodes:
    - nodeType: Source
      name: sensors
      sourceSettings:
        endpointRef: default
        dataSources:
          - telemetry/temperature

    - nodeType: Graph
      name: convert
      graphSettings:
        registryEndpointRef: default
        artifact: azureiotoperations/graph-dataflow-map:1.0.0
        configuration:
          - key: rules
            value: |
              {
                "map": [
                  {
                    "inputs": ["*"],
                    "output": "*"
                  },
                  {
                    "inputs": ["temperature"],
                    "output": "temperature_f",
                    "expression": "cToF($1)"
                  }
                ]
              }

    - nodeType: Destination
      name: output
      destinationSettings:
        endpointRef: default
        dataDestination: telemetry/converted

  nodeConnections:
    - from:
        name: sensors
      to:
        name: convert
    - from:
        name: convert
      to:
        name: output
Apply the manifest:
kubectl apply -f <FILE>.yaml
The source defines where data enters the pipeline. Specify an endpoint reference and one or more topics.
In the data flow graph editor, select the source element and configure:
| Setting |
Description |
| Endpoint |
The data flow endpoint to use. Select default for the local MQTT broker. |
| Topics |
One or more topics to subscribe to for incoming messages. |
{
  nodeType: 'Source'
  name: 'sensors'
  sourceSettings: {
    endpointRef: 'default'
    dataSources: [
      'telemetry/temperature'
      'telemetry/humidity'
    ]
  }
}
Important
The use of Kubernetes deployment manifests isn't supported in production environments and should only be used for debugging and testing.
- nodeType: Source
  name: sensors
  sourceSettings:
    endpointRef: default
    dataSources:
      - telemetry/temperature
      - telemetry/humidity
Transforms process data between the source and destination. Each transform references a built-in artifact and is configured with rules.
The available built-in transforms are:
| Transform |
Artifact |
Description |
| Map |
azureiotoperations/graph-dataflow-map:1.0.0 |
Rename, restructure, compute, and copy fields |
| Filter |
azureiotoperations/graph-dataflow-filter:1.0.0 |
Drop messages that match a condition |
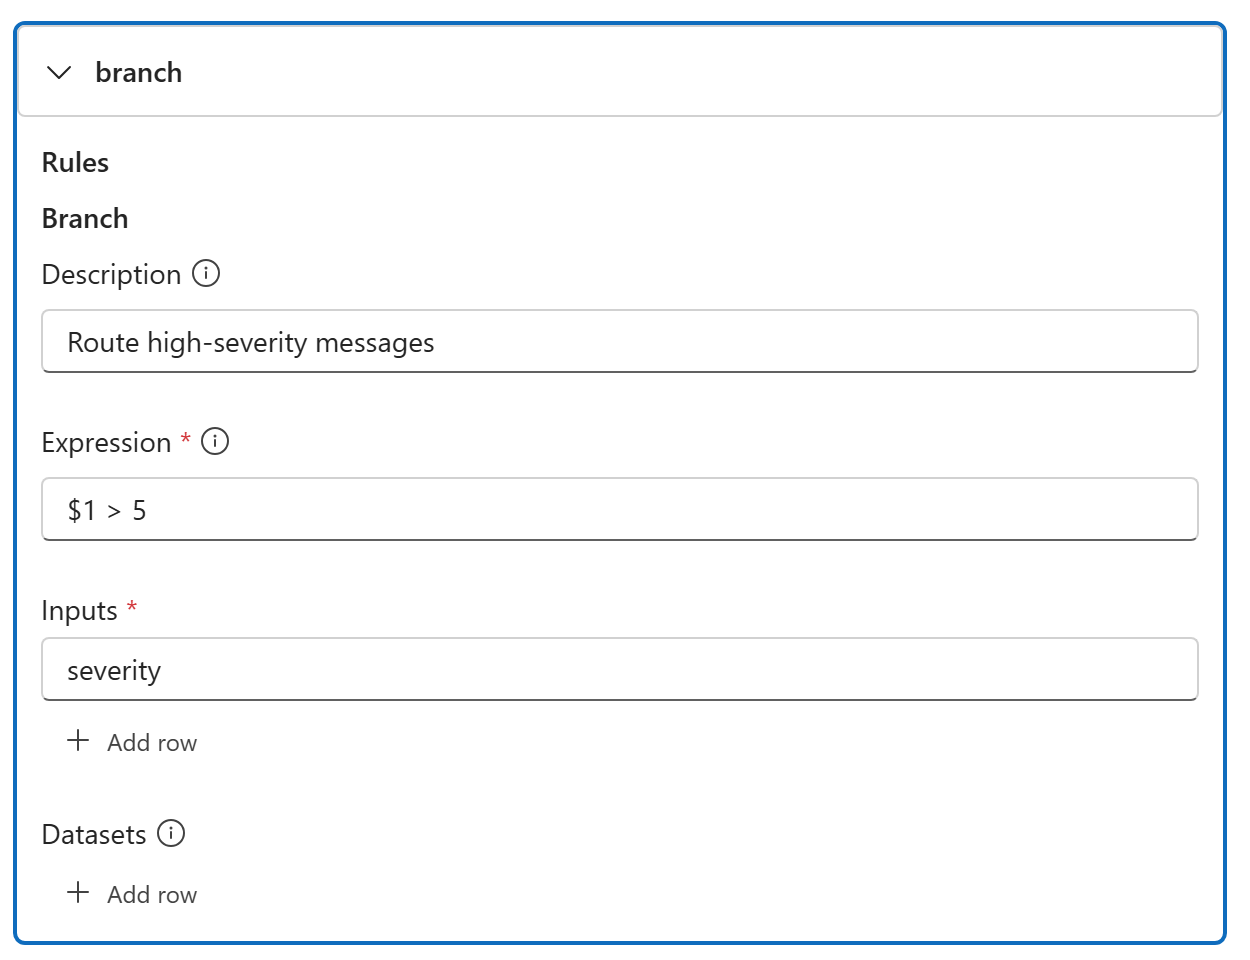
| Branch |
azureiotoperations/graph-dataflow-branch:1.0.0 |
Route messages to a true or false path |
| Concatenate |
azureiotoperations/graph-dataflow-concatenate:1.0.0 |
Merge branched paths back together |
| Window |
azureiotoperations/graph-dataflow-window:1.0.0 |
Aggregate data over a time interval |
For detailed configuration of each transform type, see:
In the data flow graph editor, select Add transform and choose the transform type. Configure the rules in the visual editor.
Each transform is a node with nodeType: 'Graph'. The configuration property passes rules as a JSON string:
{
  nodeType: 'Graph'
  name: 'convert'
  graphSettings: {
    registryEndpointRef: 'default'
    artifact: 'azureiotoperations/graph-dataflow-map:1.0.0'
    configuration: [
      {
        key: 'rules'
        value: '{"map":[{"inputs":["temperature"],"output":"temperature_f","expression":"cToF($1)"}]}'
      }
    ]
  }
}
Important
The use of Kubernetes deployment manifests isn't supported in production environments and should only be used for debugging and testing.
Each transform is a node with nodeType: Graph. The configuration property passes rules as a JSON string:
- nodeType: Graph
  name: convert
  graphSettings:
    registryEndpointRef: default
    artifact: azureiotoperations/graph-dataflow-map:1.0.0
    configuration:
      - key: rules
        value: |
          {
            "map": [
              {
                "inputs": ["temperature"],
                "output": "temperature_f",
                "expression": "cToF($1)"
              }
            ]
          }
You can chain any number of transforms. Connect them in the nodeConnections section in the order you want data to flow:
Drag connections between transforms on the canvas to define the processing order.
nodeConnections: [
  { from: { name: 'sensors' }, to: { name: 'remove-bad-data' } }
  { from: { name: 'remove-bad-data' }, to: { name: 'convert' } }
  { from: { name: 'convert' }, to: { name: 'output' } }
]
Important
The use of Kubernetes deployment manifests isn't supported in production environments and should only be used for debugging and testing.
nodeConnections:
  - from: { name: sensors }
    to: { name: remove-bad-data }
  - from: { name: remove-bad-data }
    to: { name: convert }
  - from: { name: convert }
    to: { name: output }
The destination defines where processed data is sent. Specify an endpoint reference and a topic or path.
Select the destination element and configure:
| Setting |
Description |
| Endpoint |
The data flow endpoint to send data to. |
| Topic |
The topic or path to publish processed data to. |
{
  nodeType: 'Destination'
  name: 'output'
  destinationSettings: {
    endpointRef: 'default'
    dataDestination: 'telemetry/processed'
  }
}
Important
The use of Kubernetes deployment manifests isn't supported in production environments and should only be used for debugging and testing.
- nodeType: Destination
  name: output
  destinationSettings:
    endpointRef: default
    dataDestination: telemetry/processed
For dynamic topic routing based on message content, see Route messages to different topics.
Verify the data flow graph is working
After you deploy a data flow graph, verify it's running:
In the Operations experience, select your data flow graph to view its status. A healthy graph shows a Running state.
Check the status of the DataflowGraph resource:
az resource show --resource-group <RESOURCE_GROUP> --resource-type Microsoft.IoTOperations/instances/dataflowProfiles/dataflowGraphs --name <GRAPH_NAME> --parent instances/<INSTANCE_NAME>/dataflowProfiles/<PROFILE_NAME>
Important
The use of Kubernetes deployment manifests isn't supported in production environments and should only be used for debugging and testing.
kubectl get dataflowgraph temperature-processing -n azure-iot-operations
Check the pod logs for any errors:
kubectl logs -l app=dataflow -n azure-iot-operations --tail=50
Next steps


