Merk
Tilgang til denne siden krever autorisasjon. Du kan prøve å logge på eller endre kataloger.
Tilgang til denne siden krever autorisasjon. Du kan prøve å endre kataloger.
In this guide, you learn how to work with query results in the Azure Data Explorer web UI by using the results grid. By using the results grid, you can customize and manipulate your results, and enhance the efficiency and effectiveness of your data analysis.
To learn how to run queries, see Quickstart: Query data in the Azure Data Explorer web UI.
Prerequisites
- A Microsoft account or a Microsoft Entra user identity. You don't need an Azure subscription.
- An Azure Data Explorer cluster and database. Use the publicly available help cluster or create a cluster and database.
Expand a cell
Expand a cell to copy or view the cell content. This feature is especially helpful for viewing dynamic data or long strings. Left-click a cell to open the detailed view.
Expand a row
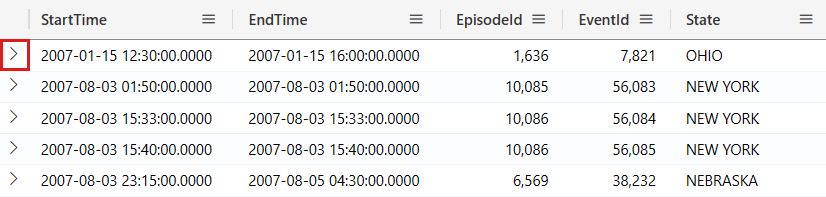
Expand a row to open a detailed view of the row content. This detailed view shows the different columns and their content. To expand a row, follow these steps:
On the left side of the row you want to expand, select the arrow icon >.
In the detailed view that opens, you can do the following tasks:
- View and copy the content of each column.
- Search within the detailed view. To learn how to do so, see Search in detailed view.
- Switch reading pane modes between Inline, Below, and Right. The default mode is Inline, which shows the detailed view in a flyout pane. The Below and Right modes show the detailed view in a docked pane below or to the right of the results grid, respectively.


Search in detailed view
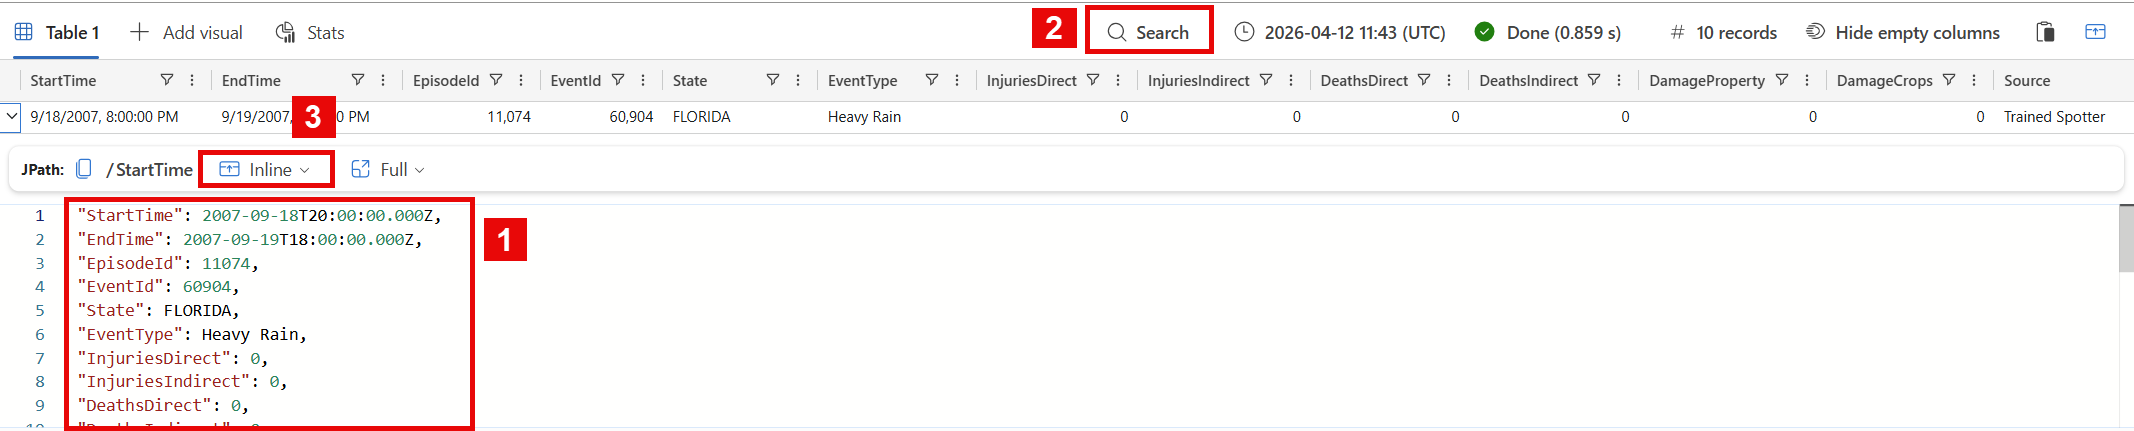
You can perform free text search within the detailed view of a result. To learn how to do so, follow these steps:
Run the following query.
StormEvents
| where InjuriesIndirect > 0
Expand a row in the result grid to open the detailed view.
Select the detailed view window.
To initiate a free text search bar, press the keyboard shortcut "Ctrl + F".
Input "injur". All instances of the searched term are highlighted.


Note
The search function isn't case sensitive by default.
Get the path to a dynamic field
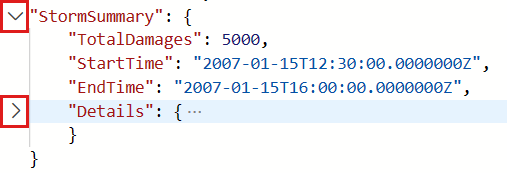
Nested dynamic property-bag fields can become complex as you go deeper into their layers. In the results grid, the JPATH indicates the path through the dynamic property-bag object fields to arrive at the given field. To learn how to find a JPATH, follow these steps:
Run the following query.
StormEvents
| take 10
Select the first result in the
StormSummarycolumn, which is the last column.Select different fields within the result and see how the JPATH at the top of the window changes. For example, the following screenshot shows the path to the
Locationfield, which is nested under theDetailsfield within theStormSummarycolumn dynamic property-bag object.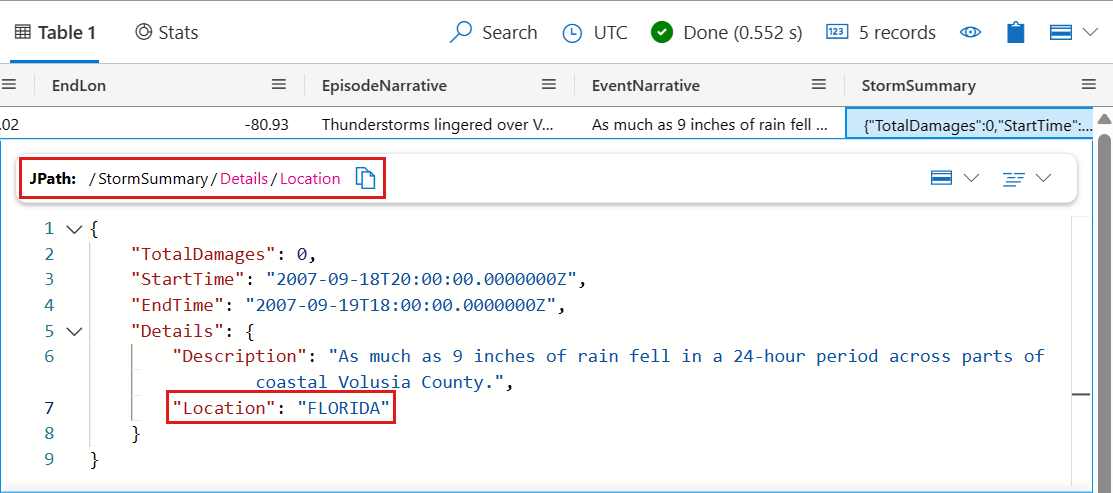
Select the icon to the right of the JPATH to copy it. Then, paste and use the JPATH as a filter or share it with others.

Add filter from dynamic field
To add a specific dynamic field as a filter to your query, complete the following steps:
Run the following query.
StormEvents
| take 10
Select the first result in the
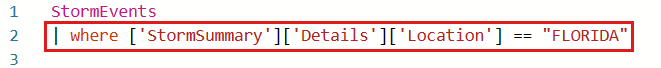
StormSummarycolumn, which is the last column.Right-click a field within a dynamic data and select Add as filter. For example, right-click the
Locationfield and add it as a filter.
In the query editor, a query clause is added to your query based on the selected dynamic field.


Add filter from query result
To add a filter operator to the query directly from the result grid, follow these steps:
Run the following query.
StormEvents
| take 10
Select the cells with content for which you want to create a query filter. To select multiple cells, click and drag your mouse over the cells you want to select, or hold down the "Ctrl" key while clicking on each cell. For example, select multiple cells from the
StateandEventTypecolumns.Right-click to open the cell actions menu. Select Add selection as filters.

In the query editor, a query clause is added to your query based on the selected cells.


Group column by results
Within a result set, you can group the results by any column. After this grouping, you can perform further aggregations to investigate the data. To group and explore column results, follow these steps:
Run the following query:
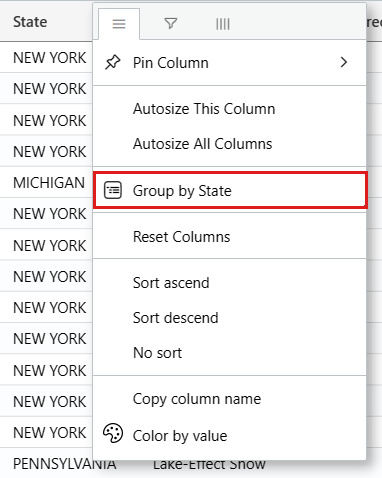
StormEvents
| where EventType == "Lake-Effect Snow"
Mouse over the State column, select the menu, and select Group by State.
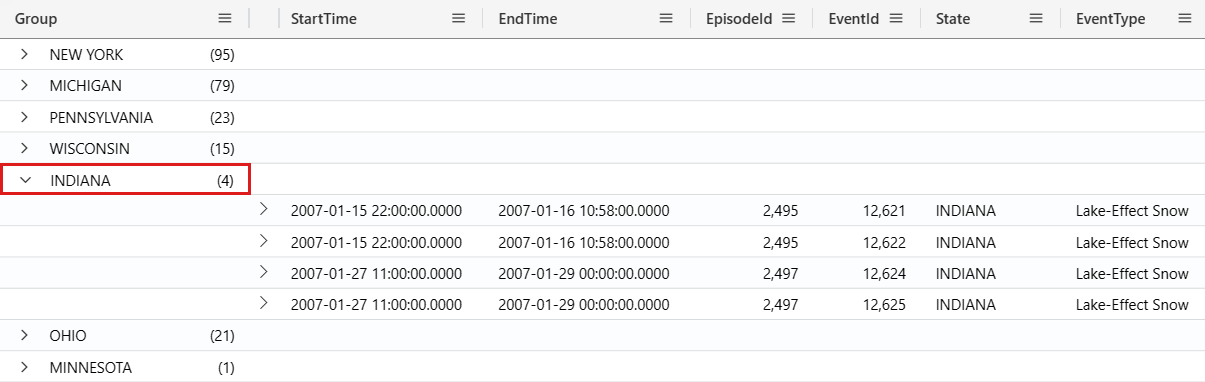
The following screenshot shows the result after selecting Group by State.

In the grid, double-click on a record to expand and see records for that state. For example, expand the records for "INDIANA". This type of grouping can be helpful when doing exploratory analysis.
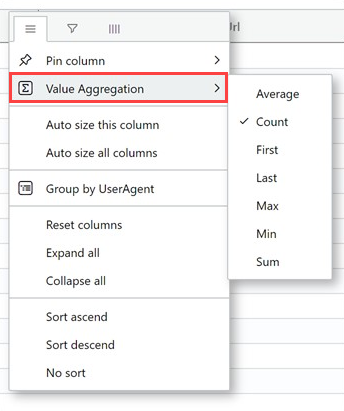
Once you group data by a column, use a value aggregation function to calculate statistics for each group. Go to the column menu, choose Value Aggregation, and select the function type to use for that column.
To return the results grid to its original state, select the menu of the Group column. Then, select Reset columns.


Filter columns
To filter the results of a specific column, follow these steps:
Select the menu for the column to filter.
Select the filter icon.
In the filter builder, select the desired operator.
Type in the expression by which to filter the column. Results are filtered as you type.
Note
The filter isn't case sensitive.
To create a multi-condition filter, select a boolean operator to add another condition.
To remove the filter, delete the text from your first filter condition.
View cell statistics
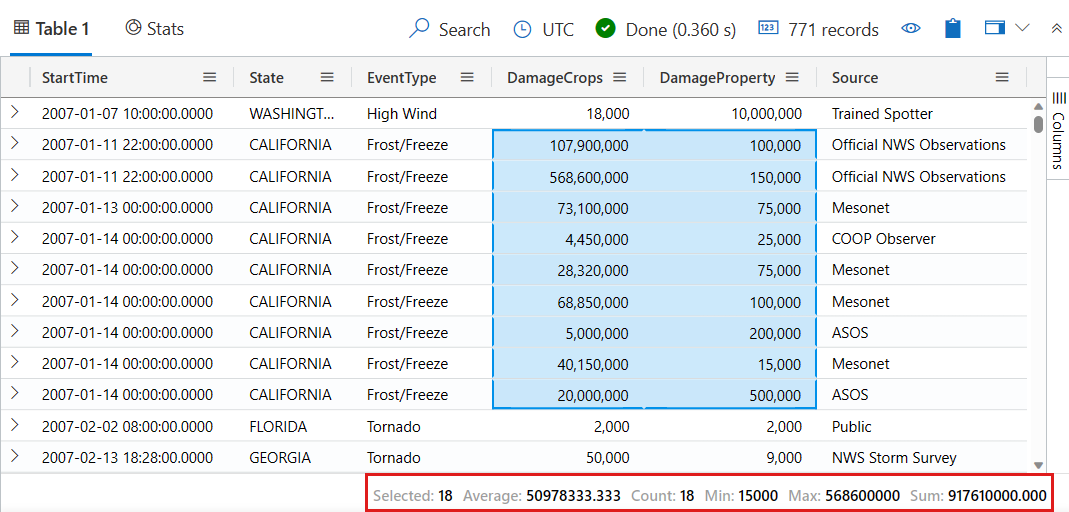
To quickly calculate the Average, Count, Min, Max, and Sum for several rows, select the relevant numerical cells. For example:
Run the following query.
StormEvents
| where DamageCrops > 0 and DamageProperty > 0
| project StartTime, State, EventType, DamageCrops, DamageProperty, Source
Select a few of the numerical cells. To select multiple cells, click and drag your mouse over the cells you want to select, or hold down the "Ctrl" key while clicking on each cell. The Average, Count, Min, Max, and Sum are automatically calculated for these cells.

Make a pivot table
Pivot mode is similar to Excel’s pivot table. Pivot mode allows you to turn column values into columns. For example, you can pivot on the State column to make columns for "Florida", "Missouri", "Alabama", and so on. To create a pivot table, follow these steps:
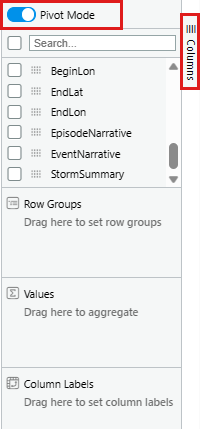
On the right side of the results grid, select Columns to see the table tool panel. At the top of the panel, select Pivot Mode.
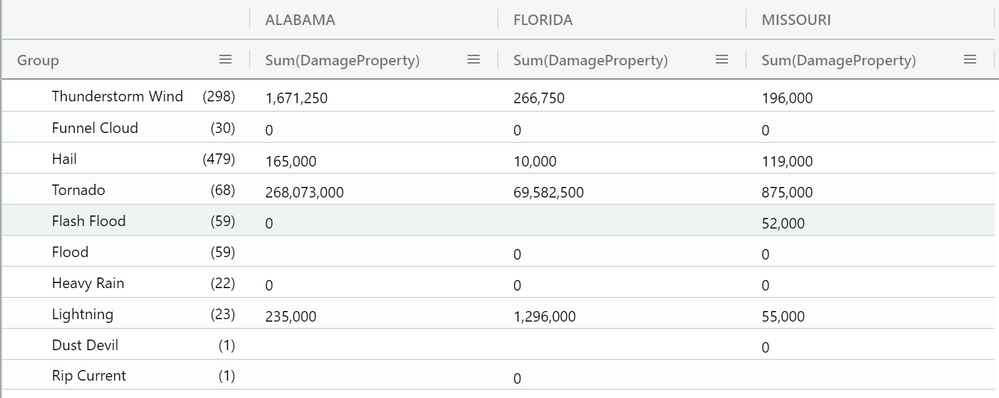
Drag columns to the Row groups, Values, Column labels sections. For example, if you drag EventType to Row groups; DamageProperty to Values; and State to Column labels, then the result should look like the following pivot table.


Search in the results grid
To search for a specific expression within a result table, use the search capability. For example:
Run the following query.
StormEvents
| where DamageProperty > 5000
| take 1000
In the top menu of the results grid, on the right side, select Search and type in "Wabash".
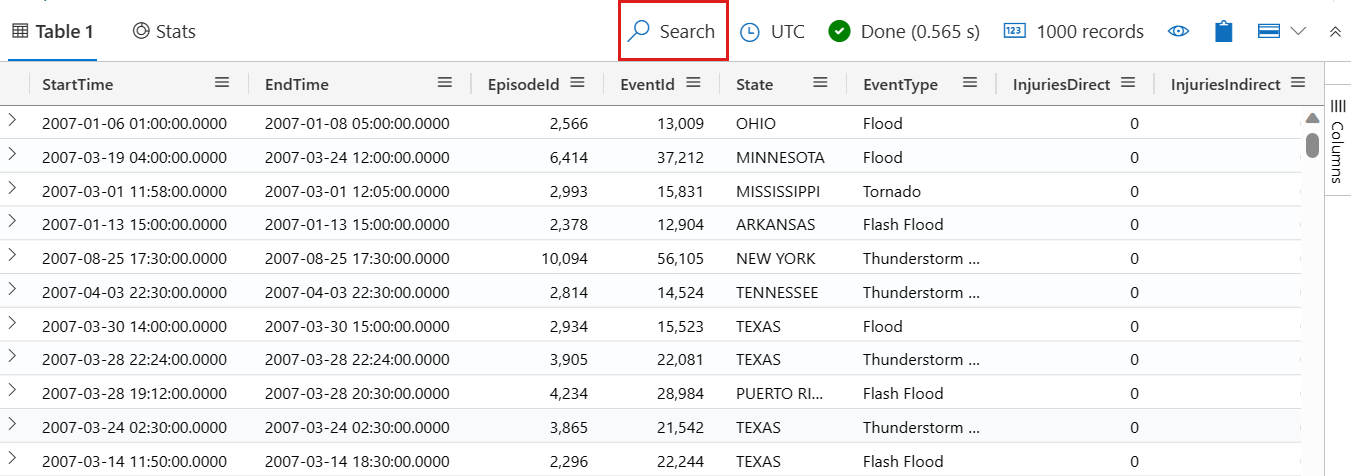
All mentions of your searched expression are now highlighted in the table. You can navigate between them by pressing Enter to go forward, Shift+Enter to go backward, or by using the up and down buttons beside the search box to move around.

To only display rows that contain your search query, turn on the Show only rows that fit search option located at the top of the search window.


Color results by value
To color the rows of results based on a column value, follow these steps:
Run the following query.
StormEvents
| take 10
Right-click on a value in the
Statecolumn.Select Explore results, and then select Color by value.

The results are colored by the values in the
Statecolumn.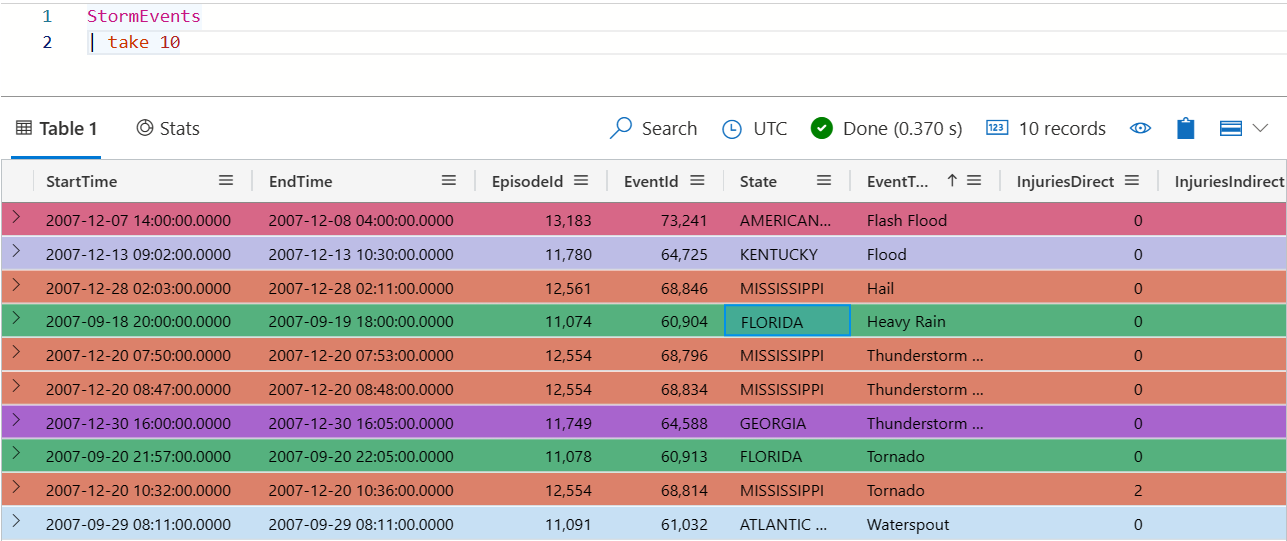


Color results by error level
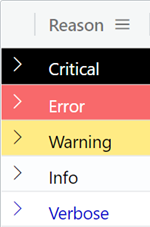
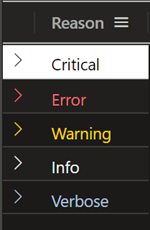
The results grid can color results based on error severity or verbosity level. To turn on this feature, alter your settings as described in Highlight error levels.
| Error level color scheme in Light mode | Error level color scheme in Dark mode |
|---|---|
|
|
Hide empty columns
To hide or show empty columns, select the eye icon in the menu of the results grid.
