Nota
L'accesso a questa pagina richiede l'autorizzazione. È possibile provare ad accedere o modificare le directory.
L'accesso a questa pagina richiede l'autorizzazione. È possibile provare a modificare le directory.
Note
Community interest groups have now moved from Yammer to Microsoft Viva Engage. To join a Viva Engage community and take part in the latest discussions, fill out the Request access to Finance and Operations Viva Engage Community form and choose the community you want to join.
This article explains how to debug X++ code by using the debugging feature in Microsoft Visual Studio.
To debug X++ code, use the debugger in Microsoft Visual Studio. The process is similar to that for any other application created in Visual Studio. For example, when your code stops at a breakpoint, you can use the standard tools to examine the application.
Debug your code
To debug X++ code, follow these steps:
In Visual Studio, open the X++ code to debug.
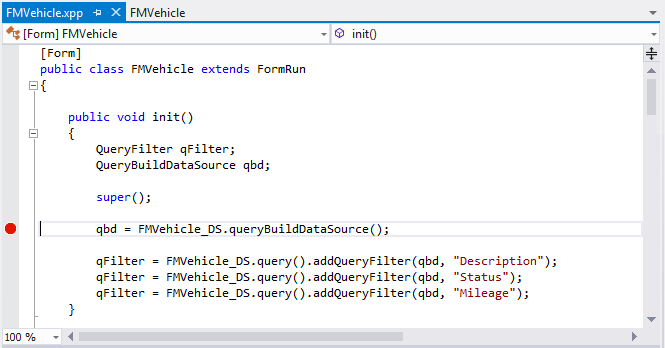
Find the line or lines where you want execution to stop, and set breakpoints in those lines. To set a breakpoint in a line, click in the left column of the code editor or press F9 while the cursor is on that line. A red dot indicates that a breakpoint is set.
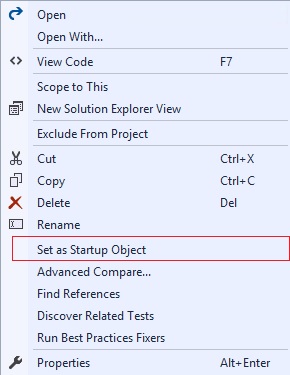
Set a startup project and a startup object. Startup objects can be any form, any class that has the main method, or any menu item. Set the startup object in the Properties pane for the project. Alternatively, right-click the element in Solution Explorer, and then select Set as Startup Object.
On the Debug menu, select Start Debugging.
In the application, perform the action that causes the code that you're interested in to run. Typical actions include opening a form. Processing stops at the breakpoints that you set.
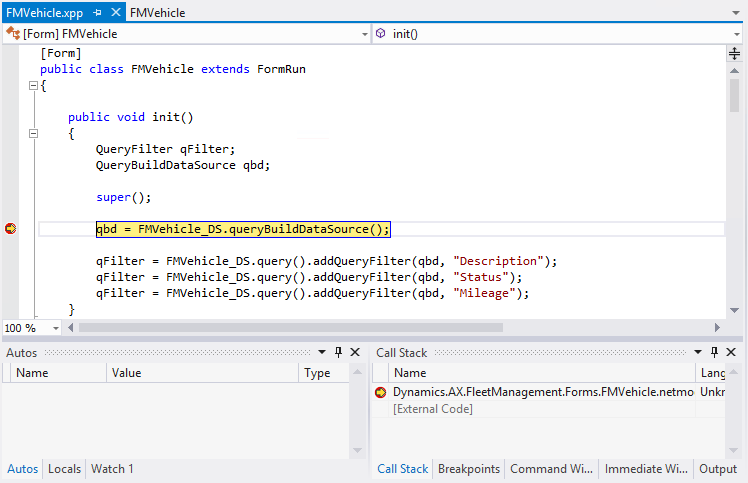
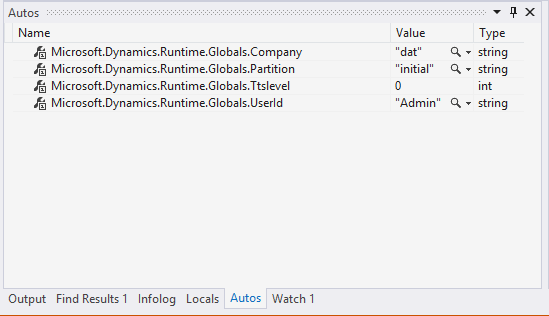
Use the tools in Visual Studio to examine the application. For example, you can hover over variables in the X++ code to see their values. You can also use commands on the Debug menu to step through the code. Additionally, tools such as the Autos pane in Visual Studio show important information about the state of the application.
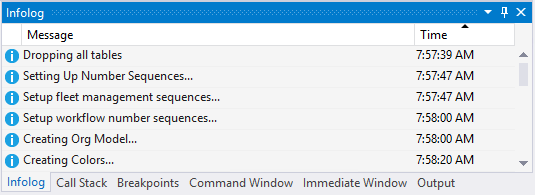
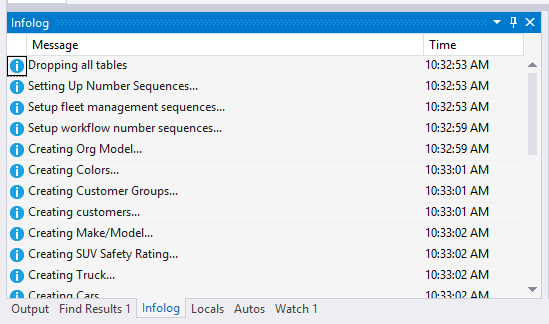
Another tool that's specific to finance and operations applications is the Infolog. Often, info() statements are added to code to log status messages while the application is running. You can view these Infolog messages directly in Visual Studio. On the View menu, select Infolog.
When you finish debugging the application, exit the application. Visual Studio exits debugging mode.


Add ToString methods to your classes
It's often beneficial to add ToString methods to your classes. The effort you spend on this practice pays off many times over, and it's easy to implement.
Note
Because ToString methods can be called at unpredictable times, don't change the state of the object in the ToString method.
Identify unselected fields
It's a common source of bugs to use fields from a table when those fields don't appear in the field list in a select statement. Such fields will have a default value according to their type. You can use debugger breakpoints to determine if a value has been selected or not.
Consider the following code:
class MyClass
{
    public static void Main(Args a)
    {
        FMRental rental;
        select EndMileage, RentalId from rental;
        rental.Comments = "Something";
    }
}
Set a breakpoint on the assignment statement. Make your class the startup object in your project, and start by pressing F5. When the breakpoint is encountered, view the rental variable by expanding it in the Locals window. The fields that are selected, EndMileage and RentalId, appear with their selected values, while the unselected fields appear as null. It means that these values aren't fetched from the database. This is a debugging artifact. The values of the unselected fields are the default value for the type of the field. Step over this statement and notice how the debugger changes the rendering to the actual value.
Note
If the table is set to Cache, the system will always fetch all fields from the entire table, irrespective of the field list provided in the code.
The Auto and Infolog windows
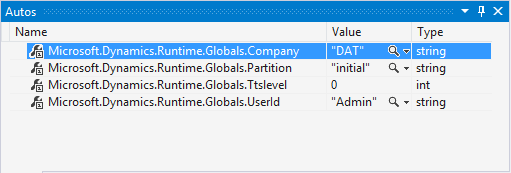
The debugger lets you easily access certain parts of the state of the application. This information is available in the Autos window, where the current company, the partition, the transaction level, and the current user ID are listed.
There is also a window showing the data that is written to the Infolog.
Breakpoint features
The Visual Studio debugger supports conditional breakpoints and breakpoints that are triggered by hit count. You can also have the system perform specific actions for you as you hit the breakpoint.
- Hit count enables you to determine how many times the breakpoint is hit before the debugger breaks execution. By default, the debugger breaks execution every time that the breakpoint is hit. You can set a hit count to tell the debugger to break every two times the breakpoint is hit, or every 10 times, or every 512 times, or any other number you choose. Hit counts can be useful because some bugs don't appear the first time your program executes a loop, calls a function, or accesses a variable. Sometimes, the bug doesn't appear until the 100th or the 1,000th iteration. To debug such a problem, you can set a breakpoint with a hit count of 100 or 1,000.
- Condition is an expression that determines whether the breakpoint is hit or skipped. When the debugger reaches the breakpoint, it evaluates the condition. The breakpoint is hit only if the condition is satisfied. You can use a condition with a location breakpoint to stop at a specified location only when a certain condition is true. For example, suppose you're debugging a banking program where the account balance is never allowed to go below zero. You might set breakpoints at certain locations in the code and attach a condition such as
balance < 0to each one. When you run the program, execution breaks at those locations only when the balance is less than zero. You can examine variables and program state at the first breakpoint location, and then continue execution to the second breakpoint location, and so on. - Action specifies something that should occur when the breakpoint is hit. By default, the debugger breaks execution, but you can choose to print a message or run a Visual Studio macro instead. If you decide to print a message instead of breaking, the breakpoint has an effect very similar to a Trace statement. This method of using breakpoints is called trace points.
Using breakpoints with conditions
Consider the following code:
class PVsClass
{
    public static void Main(Args a)
    {
        int i;
        for (i = 0; i < 10; i++)
        {
            print i;
        }
    }
}
Put a breakpoint on the print statements by pressing F9 while that statement is selected. This action creates a normal, unconditional breakpoint. Now, use the mouse to open the context menu for the breakpoint and select Condition. Enter a condition that indicates that the breakpoint should happen when the value of the i variable exceeds 5. Set the class as a startup project, and the class containing the code as the startup item in the project. Run the code. Feel free to modify the value of i by using the debugger. Now, remove this breakpoint, and use the Hit count feature to accomplish the same thing.
Note
A breakpoint can have several conditions. It's often helpful to hover the cursor over the breakpoint, causing an informative tooltip to appear. Trace points are often useful to trace execution. Insert a trace point on the line in question and log the value of the variable. The trace output appears in the output window in the debugger.
The Immediate window
The Immediate window is a debugger feature that lets you enter expressions and statements to evaluate at any given time. This feature isn't implemented in the X++ stack. However, you can still benefit from the immediate window. The snippets must be expressed in C#, not in X++.