Muistiinpano
Tämän sivun käyttö edellyttää valtuutusta. Voit yrittää kirjautua sisään tai vaihtaa hakemistoa.
Tämän sivun käyttö edellyttää valtuutusta. Voit yrittää vaihtaa hakemistoa.
Because custom workflow extensions are .NET Framework assemblies, you can debug them using methods similar to how you debug plug-ins.
Use the Plug-in Registration Tool
The Plug-in Registration Tool (PRT) is one of the tools you can download from NuGet. More information: Dataverse development tools.
Once you download the PRT, select the PluginRegistration.exe to run it.
Install Profiler
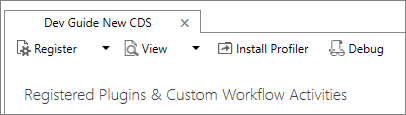
From the PRT, you can install the Plug-in profiler solution by clicking the Install Profiler button.
This solution adds the capability to capture the context that is passed to your workflow activity and enables replay that you can use to debug the logic in your code locally using Visual Studio.
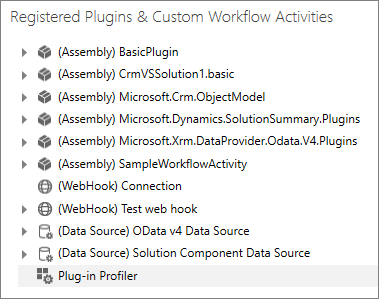
When the Plug-in profiler is installed for your Microsoft Dataverse instance, you'll see it in the PRT at the bottom of the list of Registered Plugins & Custom Workflow Activities.
Profile a workflow activity
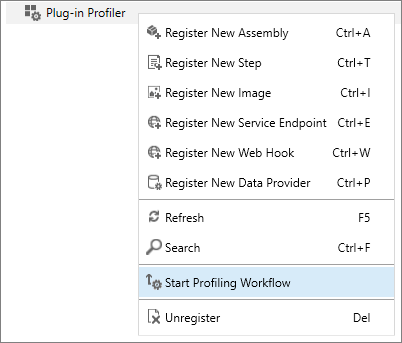
To profile a workflow activity, right-click on the Plug-in Profiler and select Start Profiling Workflow.
The Profiler Settings dialog that provides the following options:
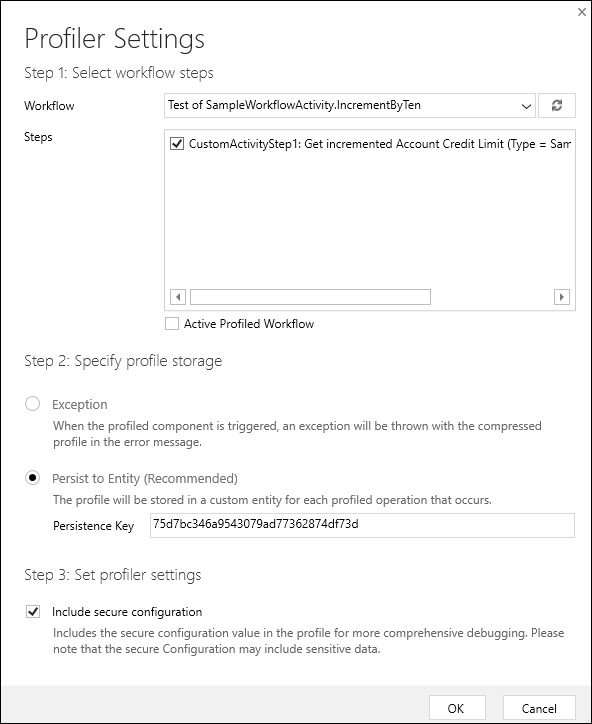
| Field | Description |
|---|---|
| Workflow | Select the Workflow that contains the workflow activity you want to debug. |
| Steps | Select the specific steps within that workflow that you want to debug. |
| Specify profile storage | We recommend that you choose Persist to Entity. |
| Set profiler settings | If you are working with a system where the workflow is being executed frequently, you can reduce performance impact by choosing to limit the number of profiles that are captured. |
| Include secure configuration | This provides the option to avoid seeing potentially sensitive data that may be passed as secure configuration. |
Select OK to save your settings.
Note
At the time of this writing, you may see the following error:
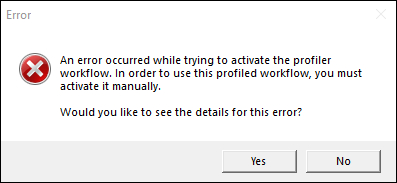
The details of this error include the message: Automatic workflow cannot be published if no activation parameters have been specified.
The profile settings are successfully saved. This error occurs because the process of profiling a custom workflow activity creates a copy of the workflow and disables both the original workflow and the copy. You'll need to reconfigure the profiled copy and activate it to capture a profile. For more information, see the following steps.
Capture a profile
When a profile for workflow containing a custom workflow activity is configured, a copy of the original workflow is created and it has the text (Profiled) appended to the name. Both the original and the copy of the workflows are deactivated.
Note
Unless you're working in the system Default solution, you may not see the copied workflow because it's added to that solution. To view the copied workflow in the solution you're working in, you need to select Add Existing and add this copy to your solution.
The deactivated workflows should look like this:
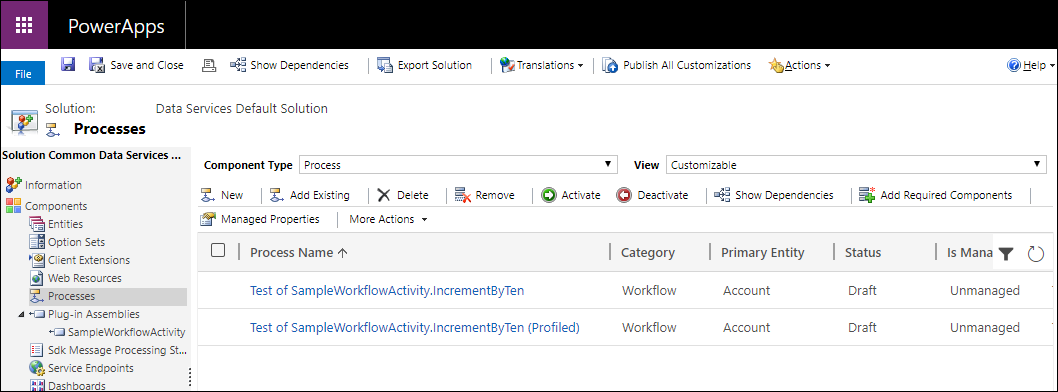
When the workflow is copied, some of the configuration is lost. If you try to activate the copied workflow, you'll get the following error: An automatic process cannot be activated if no activation parameters have been specified. Add activation parameters, and then activate. ...
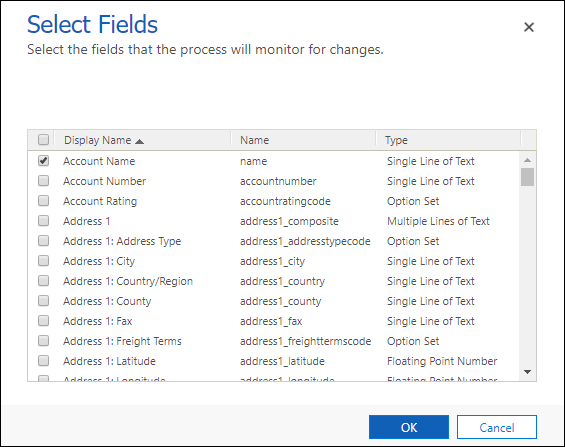
This means you have to reconfigure the Start when properties of the workflow. In this case, we want to set the workflow to start when the Account Name field changes:
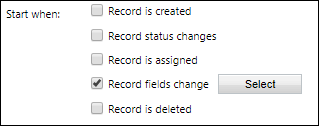
Select the Select button to choose the Account Name field.
The copied profile workflow is changed to a background (asynchronous) workflow. It is easier to test a real-time (synchronous) workflow, so in the menu bar select Convert to a real-time workflow.
Save the copied profile workflow and activate it.
In an app connected to your Dataverse instance, or by using the web services, update the Account Name value of an account entity. This change initiates capture of the context instance passed to your custom workflow activity and persist it as a profile record in the system.
Tip
If your workflow is asynchronous, make sure that it completes before moving on to the next step. Go to Settings > System Jobs and verify that the workflow succeeded.
Stop profiling
After you have captured the profile you need to debug, you should stop profiling the plug-in.
To stop profiling, unregister the workflow using the PRT.
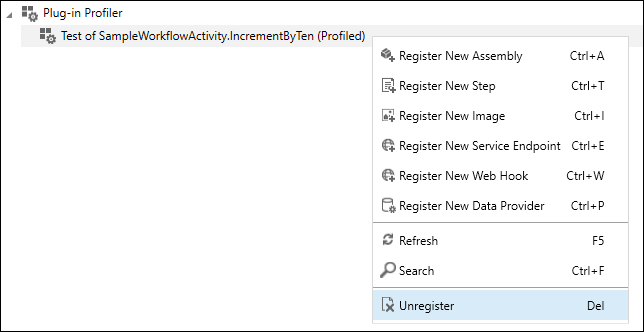
This deletes the copy of the workflow that was made.
Important
The workflow that was copied will still be deactivated. You'll need to manually reactivate it if you want it to be applied.
Debug your assembly
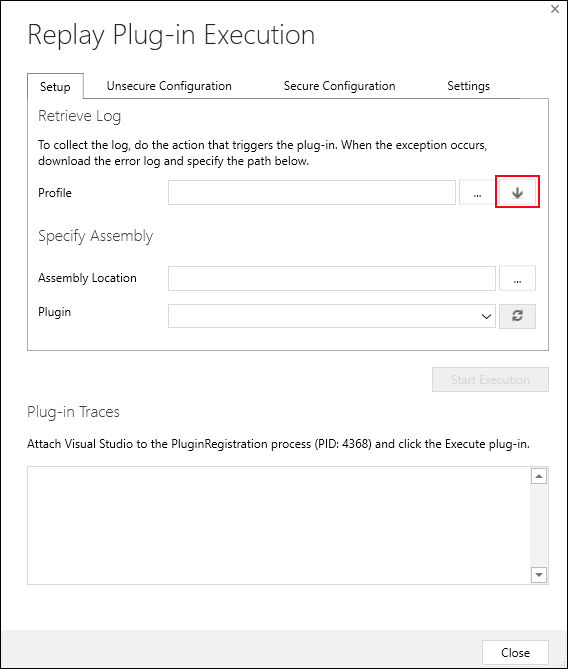
In the PRT, select Replay Plug-in execution.
In the Replay Plug-in Execution dialog, on the Setup tab, select the download button to select a Profile.
Note
The Unsecure Configuration, Secure Configuration, and Settings tabs aren't used for workflow activity debugging. They're only used for Plug-ins.
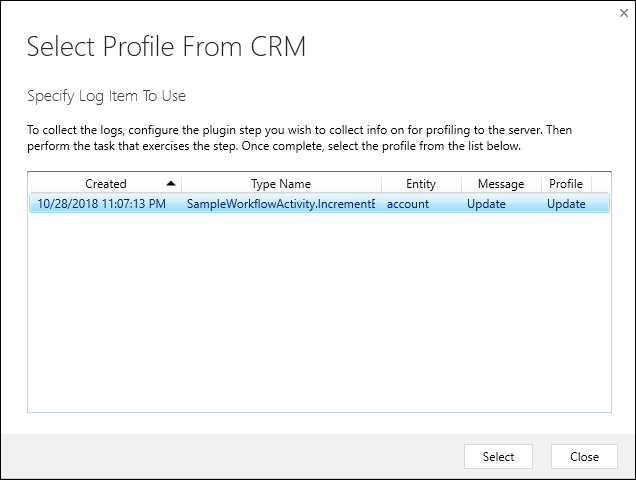
In the Select Profile from CRM dialog, choose the most recent profile that represents the one you generated.
Note
You can manage captured profiles in the Dynamics 365 - custom web application by navigating to Settings > Extensions > Plug-in Profiles.
Select Select to close the dialog.
In the Assembly Location field, select the ellipses (...) button to add the location of the assembly that contains the workflow activity you're debugging.
Open your Workflow Activity project in Visual Studio.
Add a breakpoint to a line within the
Executemethod of your workflow activity.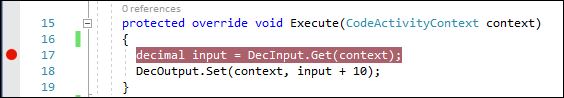
From the Debug menu, select Attach to Process....
Look for the process for
PluginRegistration.exe.Tip
The search filter helps you find this faster. The Process ID (PID) assigned to the process is different for each session. The PID is shown in the Replay Plug-in Execution dialog under Plug-in Traces.
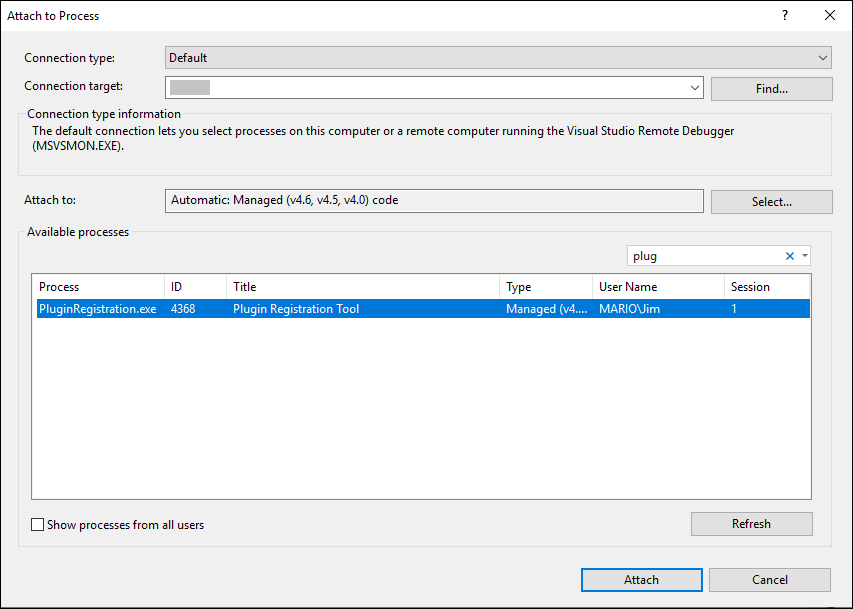
Select Attach to attach your Visual Studio debugger to the PRT application that is to run the process replay.
In the PRT Replay Plug-in Execution dialog, select the Start Execution button.
You should now be able to step through your code and debug your workflow activity using Visual Studio.