Exercise - Explore SDOH data in lakehouses
In this exercise, you explore the data that you loaded into OneLake. You can use data in the silver lakehouse to understand the extent to which the food environment and social economic makeup of an area impacts the number of patients who have diabetes.
Analyze data from the silver lakehouse
Now, you can query the fast-food restaurants and median household income from an area to view relevant metrics.
Select the FL HC Cloud workspace that you created.
Locate and open the FLHealthcare_msft_silver lakehouse.
Select Open notebook > New notebook.

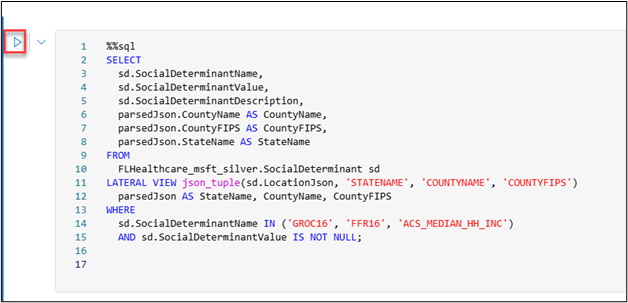
Paste the following query. Replace FL with your initials.
%%sql
SELECT
  sd.SocialDeterminantName,
  sd.SocialDeterminantValue,
  sd.SocialDeterminantDescription,
  parsedJson.CountyName AS CountyName,
  parsedJson.CountyFIPS AS CountyFIPS,
  parsedJson.StateName AS StateName
FROM
  FLHealthcare_msft_silver.SocialDeterminant sd
LATERAL VIEW json_tuple(sd.LocationJson, 'STATENAME', 'COUNTYNAME', 'COUNTYFIPS')
  parsedJson AS StateName, CountyName, CountyFIPS
WHERE
  sd.SocialDeterminantName IN ('GROC16', 'FFR16', 'ACS_MEDIAN_HH_INC')
AND sd.SocialDeterminantValue IS NOT NULL;
Select Run cell.
The results display as follows. Select + New chart.

The first suggested chart resembles the following image.

Now, you add the patient into the query and correlate the patient records to the social determinants of health (SDOH) data to get a summary at the state level.
Select Add code cell.

Paste the following query. Replace FL with your initials.
%%sql
  WITH base_query AS (
  SELECT
      sd.SocialDeterminantName,
      CAST(sd.SocialDeterminantValue AS DOUBLE) AS SocialDeterminantValue,
    -- Ensure Numeric Data
      UPPER(sd.StateName) AS State,
    -- Standardized State Format
      sd.CountyName AS County,
      sd.CountyFIPS
  FROM (
      SELECT
          SocialDeterminantName,
          SocialDeterminantValue,
          SocialDeterminantDescription,
          parsedJson.CountyName AS CountyName,
          parsedJson.CountyFIPS AS CountyFIPS,
          UPPER(parsedJson.StateName) AS StateName
      -- Standardized Case
      FROM
          FLHealthcare_msft_silver.SocialDeterminant sd
      LATERAL VIEW json_tuple(sd.LocationJson, 'STATENAME', 'COUNTYNAME', 'COUNTYFIPS')
          parsedJson AS StateName, CountyName, CountyFIPS
  ) sd
      WHERE sd.SocialDeterminantName IN ('GROC16', 'FFR16', 'ACS_MEDIAN_HH_INC', 'SAIPE_PCT_POV')
      AND sd.SocialDeterminantValue IS NOT NULL
  ),
  social_determinants AS (
      SELECT
          State,
          MAX(CASE WHEN SocialDeterminantName = 'GROC16' THEN SocialDeterminantValue END) AS Grocery_stores_2016,
          MAX(CASE WHEN SocialDeterminantName = 'FFR16' THEN SocialDeterminantValue END) AS Fast_food_restaurants_2016,
          MAX(CASE WHEN SocialDeterminantName = 'ACS_MEDIAN_HH_INC' THEN SocialDeterminantValue END) AS Median_household_income,
          MAX(CASE WHEN SocialDeterminantName = 'SAIPE_PCT_POV' THEN SocialDeterminantValue END) AS Estimated_percentage_of_people_of_all_ages_in_poverty
      FROM base_query
      GROUP BY State
      ),
      ExpandedPatients AS (
      SELECT
          p.idOrig AS id_orig,
          address_item.postalCode AS postalCode,
          UPPER(address_item.state) AS state -- Standardized Case
      FROM
          FLHealthcare_msft_silver.Patient p
      LATERAL VIEW explode(p.address) exploded_address AS address_item
      ),
  patient_conditions AS (
      SELECT
          ep.state AS State,
          COUNT(DISTINCT CASE WHEN c.code.text LIKE '%Asthma%' THEN ep.id_orig END) AS Total_Asthma_Patients,
          COUNT(DISTINCT CASE WHEN c.code.text LIKE '%Diabetes%' THEN ep.id_orig END) AS Total_Diabetes_Patients,
          COUNT(DISTINCT CASE WHEN c.code.text LIKE '%Hypertension%' THEN ep.id_orig END) AS Total_Hypertension_Patients
      FROM
          ExpandedPatients ep
      JOIN FLHealthcare_msft_silver.Condition c
          ON ep.id_orig = c.subject.idOrig
      GROUP BY ep.state
      )
      SELECT
          sd.State,
          COALESCE(sd.Grocery_stores_2016, 0) AS Grocery_stores_2016,
          COALESCE(sd.Fast_food_restaurants_2016, 0) AS Fast_food_restaurants_2016,
          COALESCE(sd.Median_household_income, 0) AS Median_household_income, -- Ensure No NULLs
          COALESCE(sd.Estimated_percentage_of_people_of_all_ages_in_poverty, 0) AS Estimated_percentage_of_people_of_all_ages_in_poverty,
          COALESCE(pc.Total_Asthma_Patients, 0) AS Total_Asthma_Patients,
          COALESCE(pc.Total_Diabetes_Patients, 0) AS Total_Diabetes_Patients,
          COALESCE(pc.Total_Hypertension_Patients, 0) AS Total_Hypertension_Patients
      FROM
          social_determinants sd
      LEFT JOIN
          patient_conditions pc
      ON
          sd.State = pc.State;
Select Run cell.
The following results display. Select + New chart.

The first suggested chart displays as follows.

From the Suggested charts area, select Avg of Fast_food_restaurants_2016.

The chart displays as follows.

Select the Median_household_income by Total_Asthma_Patients chart. This chart is a good example of combining the patient condition with the social determinants data.


