Note
Access to this page requires authorization. You can try signing in or changing directories.
Access to this page requires authorization. You can try changing directories.
Your forecast is your real-time view of quota attainment, pipeline health, and revenue risk. Opening your forecast answers key questions: Am I on track to hit my quota? Where are my pipeline gaps? Which deals need attention right now? By regularly reviewing your forecast, you can identify deals at risk and take corrective action to close gaps before the end of the quarter.
The forecasting feature isn't supported on mobile devices.
Open and view a forecast
To view a forecast
- In the Sales Hub sitemap, go to Performance and select Forecasts.
If your organization hasn't configured a forecast or you don't have access to a configured forecast, you see an out-of-the-box forecast for the current month. Learn more about the values displayed in the forecast.
To view your organization's configured forecast
Select a forecast from the dropdown list on the left. Any forecasts for which you have permissions will appear here.
Choose the forecast period that you want to see from the dropdown list on the right.
Options in the dropdown list reflect the number of forecast periods defined in the forecast configuration. The default is the current period.
To rearrange the forecast periods in the dropdown list, contact your administrator. For more information, see Rearrange forecast periods.

Verify the Last updated time stamp to see when the forecast was last recalculated successfully. When you make any adjustments to the forecast or changes to the underlying records on the Forecasts page, the forecast is immediately recalculated. However, if you've updated the underlying records on the opportunities page or updated the forecast hierarchy, select Recalculate data to manually recalculate the forecast and refresh the page. For more information, see Maintain up-to-date forecast data.
The forecast grid displays all relevant columns as defined in the forecast configuration. The totals are aggregated by user or by territory, at each level of the hierarchy and for each period according to the forecast column attributes. As an example, see the default columns in an org chart forecast.
- The aggregated values displayed in the grid are based on the fields configured in your forecast. If these values don't match the values you expected, verify the fields used for aggregation.
- The permissions granted during the forecast configuration affects who can view the forecast values. To learn more, see Provide viewing permissions.
Default columns in an org chart forecast
The following columns are displayed by default in an org chart forecast.
| Column | What it shows | What to do |
|---|---|---|
| Users | Hierarchy of users based on the Manager field. | Expand a user to see their direct reports' forecasts rolled up. |
| Quota | Target amount set for a specific owner over the forecast period. | Compare with Committed to see the gap that needs to be closed. |
| Committed | Revenue from opportunities with high confidence (forecast category: Committed). | Review first — these are most likely to close. Look for any stalled deals and coach sellers to advance them. |
| Best Case | Revenue from opportunities with medium confidence (forecast category: Best Case). | Work with sellers to move top deals into Committed. These are your growth opportunities. |
| Pipeline | Revenue from early-stage opportunities (forecast category: Pipeline). | Nurture active deals or remove stalled ones that are inflating the number. |
| Omitted | Revenue excluded from the forecast (forecast category: Omitted). | Review periodically to ensure valid deals aren't accidentally excluded. |
| Won | Revenue from closed-won opportunities. | Track against Quota to see actual attainment. |
| Lost | Revenue from closed-lost opportunities. | Analyze patterns for coaching and pipeline strategy. |
Starting with the default forecast
Every user has instant access to a forecast for the current month — no administrator configuration required.
The out-of-the-box forecast is based on the org chart template and is available to all users.
The forecast is based on the sales team hierarchy as defined by the Manager field on the User record. This means that the forecast reflects the structure of the sales team, providing insights that align with the organization's structure.
The out-of-the-box forecast uses opportunity as the rollup entity and is available only for the current month.
To view the out-of-the-box forecast, go to Performance > Forecasts. The forecast is available for the current month. The forecast is named after the current month and fiscal year, for example, My FY2024 February forecast.
The out-of-the-box forecast is only a starting point. We recommend that you work with your administrator to configure a forecast that's tailored to your organization's needs. To learn more, see Configure a forecast.
Difference between the out-of-the-box forecast and a configured forecast
The following table lists the differences between the out-of-the-box forecast and a forecast configured for your organization.
| Out-of-the-box forecast | Configured forecast |
|---|---|
| Based on the org chart template. | Based on the template that your administrator has configured. |
| Uses opportunity as the rollup entity. | Uses a rollup entity that your administrator has configured. |
| Is available to all users. | Is available to users who have been granted access by the administrator. |
| Is available only for the current month. | Is available for the number of periods defined in the forecast configuration. |
| Forecast values are updated in near real-time. | Forecast values are only updated every 24 hours or can be refreshed manually anytime. |
| Quota value is based on previous month's won amount. | Quota value is based on the value defined in the forecast configuration. |
| Updates to the underlying records are reflected in the forecast after the forecast page is refreshed. | Updates to the underlying records are reflected in the forecast after the forecast is recalculated. |
| Can handle upto 50,000 records. | No limit on the number of records. |
| Forecasts aren't saved; at a given time, only the current month's forecast is available. | Forecasts are saved for several forecast periods and can be viewed anytime. |
Forecasts and sales hierarchy
Every forecast is attached to an organization-defined hierarchy that rolls up the values level by level. If the Org chart forecast template is used, the forecast is created based on the sales team hierarchy as defined by the manager role on the User record. Similarly, if the Territory forecast template is used, the hierarchy is based on the Territory manager lookup field.
For example, you created a forecast by using the Org chart forecast template. The hierarchy is defined based on the User record. If Alyce Durham is a sales manager with one direct report, and is designated as manager in the User record, Alyce sees the forecast for both users. Because Alyce Durham reports to Samuel Strom, Samuel will see their own forecasts along with the rolled-up forecasts of their direct reports, including Alyce's.
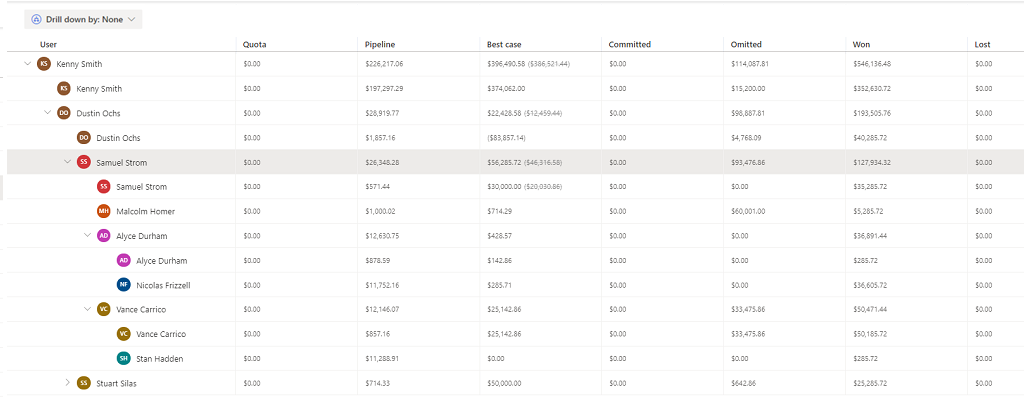
To see the rolled-up forecast for everyone in the hierarchy, expand a specific forecast.
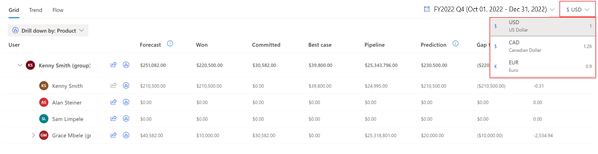
Select a currency
When your sales teams are spread across different regions, it might be confusing for users in different regions to analyze and understand the forecast in the organization's base currency. The multi-currency selection option allows the sales teams to choose and convert the forecast data in real time based on the latest exchange rate to the currencies defined in your organization. This feature aids in better planning, organization, and understanding of the current forecast state.
Administrator or forecast manager must enable the option to select currency. For more information, see Turn on multi-currency selection.
The real-time conversion of forecast data always takes place based on the latest exchange rate defined in your organization.
For example, you have sales teams in the US and Europe. The base currency for your organization is defined as US Dollar and Euro is defined as one of the currencies. When you create forecast with multi currency enabled, sales teams see the data displayed in Dollar. Sales teams in Europe can select currency as Euro and the forecast data is displayed in Euro. The conversion of currency happens in real time based on the current exchange rate. Also, manual adjustments can be made on the chosen currency.
Tasks you can do on the forecast grid
With the forecast grid, you can do the following tasks:
Can't find the feature in your app?
There are a few possibilities:
- You don't have the necessary license to use this feature. Check out the comparison table and the licensing guide to see which features are available with your license.
- You don't have the necessary security role to use this feature.
- To configure or setup a feature, you need to have the Administration and customization roles
- To use sales-related features, you need to have the Primary sales roles
- Some tasks require specific Functional roles.
- Your administrator hasn't turned on the feature.
- Your organization is using a custom app. Check with your administrator for exact steps. The steps described in this article are specific to the out-of-the-box Sales Hub and Sales Professional apps.
Related information
Project accurate revenue with sales forecasting
Configure a forecast
Analyze revenue outcome by using predictive forecasting
Troubleshoot issues with forecasting