Note
Access to this page requires authorization. You can try signing in or changing directories.
Access to this page requires authorization. You can try changing directories.
Important
Some information in this article relates to a pre-released product which may be substantially modified before it's commercially released. Microsoft makes no warranties, expressed or implied, with respect to the information provided here.
The Microsoft Defender portal presents correlated alerts, assets, investigations, and evidence from across all your assets into an incident to give you a comprehensive look into the entire breadth of an attack.
Within an incident, you analyze the alerts, understand what they mean, and gather the evidence so that you can create an effective remediation plan.
Initial investigation
Before diving into the details, take a look at the properties and the entire attack story of the incident.
You can start by selecting the incident row, but not selecting the incident name. A summary pane opens with key information about the incident, including the priority assessment, the factors influencing the priority score, the incident's details, recommended actions, and related threats. Use the up and down arrows at the top of the pane to navigate to the previous or next incident in the incident queue.

From here, you can select Open incident page. This opens the main page for the incident where you'll find the full attack story information and tabs for alerts, devices, users, investigations, and evidence. You can also open the main page for an incident by selecting the incident name from the incident queue.
Note
When users with provisioned access to Microsoft Security Copilot open an incident, they see the Copilot pane on the right side of the screen. Copilot provides real-time insights and recommendations to help you investigate and respond to incidents. For more information, see Microsoft Copilot in Microsoft Defender.
Attack story
Attack stories help you quickly review, investigate, and remediate attacks while viewing the full story of the attack on the same tab. By using an attack story, you can review the entity details and take remediation actions, such as deleting a file or isolating a device without losing context.
The following video briefly describes the attack story.
Within the attack story, you can find the alert page and the incident graph.
The incident alert page has these sections:
Alert story, which includes:
- What happened
- Actions taken
- Related events
Alert properties in the right pane (state, details, description, and others)
Not every alert has all of the listed subsections in the Alert story section.
The graph shows the full scope of the attack, how the attack spread through your network over time, where it started, and how far the attacker went. It connects the different suspicious entities that are part of the attack with their related assets such as users, devices, and mailboxes.
From the graph, you can:
Play the alerts and the nodes on the graph as they occurred over time to understand the chronology of the attack.
Open an entity pane, allowing you to review the entity details and act on remediation actions, such as deleting a file or isolating a device.
Highlight the alerts based on the entity to which they're related.
Hunt for entity information of a device, file, IP address, URL, user, email, mailbox, or cloud resource.
Go hunt
The go hunt action uses the advanced hunting feature to find relevant information about an entity. The go hunt query checks relevant schema tables for any events or alerts that involve the specific entity you're investigating. To find relevant information about the entity, select any of the following options:
- See all available queries – returns all available queries for the entity type you're investigating.
- All Activity – returns all activities associated with an entity, giving you a comprehensive view of the incident's context.
- Related Alerts – searches for and returns all security alerts that involve a specific entity, so you don't miss any information.
- All User anomalies (Preview) – returns all anomalies associated with the user from the past 30 days, helping you identify unusual behavior that might be relevant to the incident. This option is available only for user entities if you enable Microsoft Sentinel User and Entity Behavior Analytics (UEBA).

You can link the resulting logs or alerts to an incident by selecting a result and then selecting Link to incident.

If an analytics rule that you set created the incident or related alerts, you can also select Run query to see other related results.
Blast radius analysis
Blast radius analysis is an advanced graph visualization integrated into the incident investigation experience. Built on the Microsoft Sentinel data lake and graph infrastructure, it generates an interactive graph showing possible propagation paths from the selected node to predefined critical targets, scoped to the user’s permissions.
Note
Blast radius analysis extends and replaces Attack path analysis.
The blast radius graph provides a unique unified view of both prebreach and post-breach information on the incident page. During an incident investigation, analysts can see the current impact of a breach and the possible future impact in one consolidated graph. Because it's integrated into the incident graph, the blast radius graph helps security teams better understand the scope of the security incident quicker and enhance their defensive measures to reduce the likelihood of widespread damage. Blast radius analysis helps analysts better assess the risk to highly regarded targets and understand the business impact.
The following prerequisites are required to use the blast radius graph:
- You must be onboarded to Microsoft Sentinel data lake. For more information, see Onboarding to Microsoft Sentinel data lake and graph.
- Exposure management (read) permission or higher. For more information, see Manage permissions with Microsoft Defender XDR Unified role-based access control (RBAC).
Important
Attack paths and blast radius features are calculated based on the organization’s available environment data. The value in the graph increases as more data is available for its calculation. If you don't enable further workloads or fully define critical assets, blast radius graphs won't fully represent your environmental risks. For more information on defining critical assets, see Review and classify critical assets.
The following table summarizes the blast radius analysis use cases for different user roles:
| User role | Use case |
|---|---|
| Security analyst | Use blast radius analysis to investigate an incident. Instantly see the compromised component at the center of the graph and the paths to potentially compromised targets. The graph provides an intuitive visual understanding of the incident and helps you quickly learn the potential scope of a breach. Based on the target and paths, you can escalate, and trigger actions to disrupt, isolate, and contain the incident on nodes along the paths to the target. |
| IT administrators and SOC engineers | Use blast radius analysis to mobilize resources based on business impact and potential damage estimation. Engineers can prioritize the most critical vulnerabilities that require immediate attention. The engineer can proactively allocate the required resources based on the blast radius reach to critical targets in the organization by examining multiple nodes marked with vulnerabilities on the map. The engineer can clearly communicate what was protected and what was impacted and plan and prioritize additional defenses and network segmentations required to reduce further impact of future potential attacks. |
| Incident response team | Quickly determine the scope of incident, with a dynamic visual incident map enabling them to take targeted action on the systems indicated on the graph. |
| CISO or security leaders | Use the blast radius feature to indicate current status, set goals and metrics indicators, and use this to report and audit for compliance reasons. The feature can be used to track progress of defending actions and protection measures investments. |
View blast radius graphs
After selecting an incident from the list in the Incidents page, a graph view displays the entities and assets involved in the incident.
Select a node to open the context menu, and then select View blast radius. If no blast radius path is found, the menu item shows No blast radius found.
To view the blast radius of a single node in a group, use the ungroup toggle above the grid to present all nodes.

A new graph view loads showing the eight top-rated attack paths. A full list of the paths is visible on the right side panel when selecting View full blast radius list above the graph. From the list of reachable targets, you can further explore the path by selecting one of the listed targets. The right panel shows the potential path from the entry point to this target. Some nodes might not have paths associated with them.

For an explanation of the icons used for nodes and edges in the blast radius graph, see Understanding graphs and visualizations in Microsoft Defender.
Select View blast radius list to see a list of target assets. Select a target asset from the list to view its details and potential attack paths. Selecting the badges in connections shows more details about the connection.
When paths lead to grouped targets of the same types, to view discrete paths to targets, select the grouped icons. A right-side panel opens showing all the targets in the group. Selecting the check box on the left and selecting the Expand button on top displays each target and its paths separately.

Hide the blast radius graph and return to the original incident graph by selecting the node and choosing Hide blast radius.
Limitations
The following limitations apply to the blast radius graph:
Path length limitations (scope of analysis): Blast radius graph length calculations are bounded up to seven hops from the source node. The blast radius is an approximation of the full attack reach. The maximum number of hops depends on the environment:
- Five hops for cloud
- Five hops for on-premises
- Three hops for hybrid
Data freshness: Latencies might exist between a change in the organization's environment and the reflection of that change in the blast radius graph. During this time, the model might be incomplete.
Possible paths: The blast radius graph shows possible paths. It doesn't guarantee that an attacker takes every path shown.
Known attack vectors: The graph relies on known attack vectors. If attackers find a new lateral movement or new technique that has yet to be modeled, it won't be shown in the blast radius graph.
User scopes: The graph displayed is based on the allowed scopes for the viewing user. The graph shows only nodes and edges that are scoped for the user based on the defined RBAC and scoping settings. Paths containing out of scope nodes or edges aren't visible.
Island nodes: Nonconnected nodes might appear on the graph due to changes that occur between the time the data is collected and the calculation of the blast radius.
Incident details
You can view an incident's details on the right pane of an incident page. The incident details include incident assignment, ID, classification, categories, and first and last activity date and time. It also includes a description of the incident, impacted assets, active alerts, and, where applicable, the related threats, recommendations, and disruption summary and impact. Here's an example of the incident details where the incident description is highlighted.

The incident description provides a brief overview of the incident. In some cases, the first alert in the incident is used as the incident description. In this case, the description is only shown in the portal and isn't stored in the activity log, advanced hunting tables, or the Microsoft Sentinel in Azure portal.
Tip
Microsoft Sentinel customers can also view and overwrite the same incident description in the Azure portal by setting the incident description through API or automation.
Filter and focus the incident graph (preview)
Use filters on very large incidents with many alerts and entities or hide specific entities to simplify complex incident graphs. By simplifying the graph, you can focus your investigation on what matters most.
To filter an incident graph:
Select Add filter above the incident graph.
Choose any of the following available filter criteria, and then select Add:
- Severity: Display high-, medium-, or low-severity alerts.
- Status: Display new, in progress, or resolved alerts.
- Service sources: Display alerts from specific services, such as Microsoft Defender for Endpoint, Microsoft Defender for Identity, Microsoft Defender for Office 365, and others.
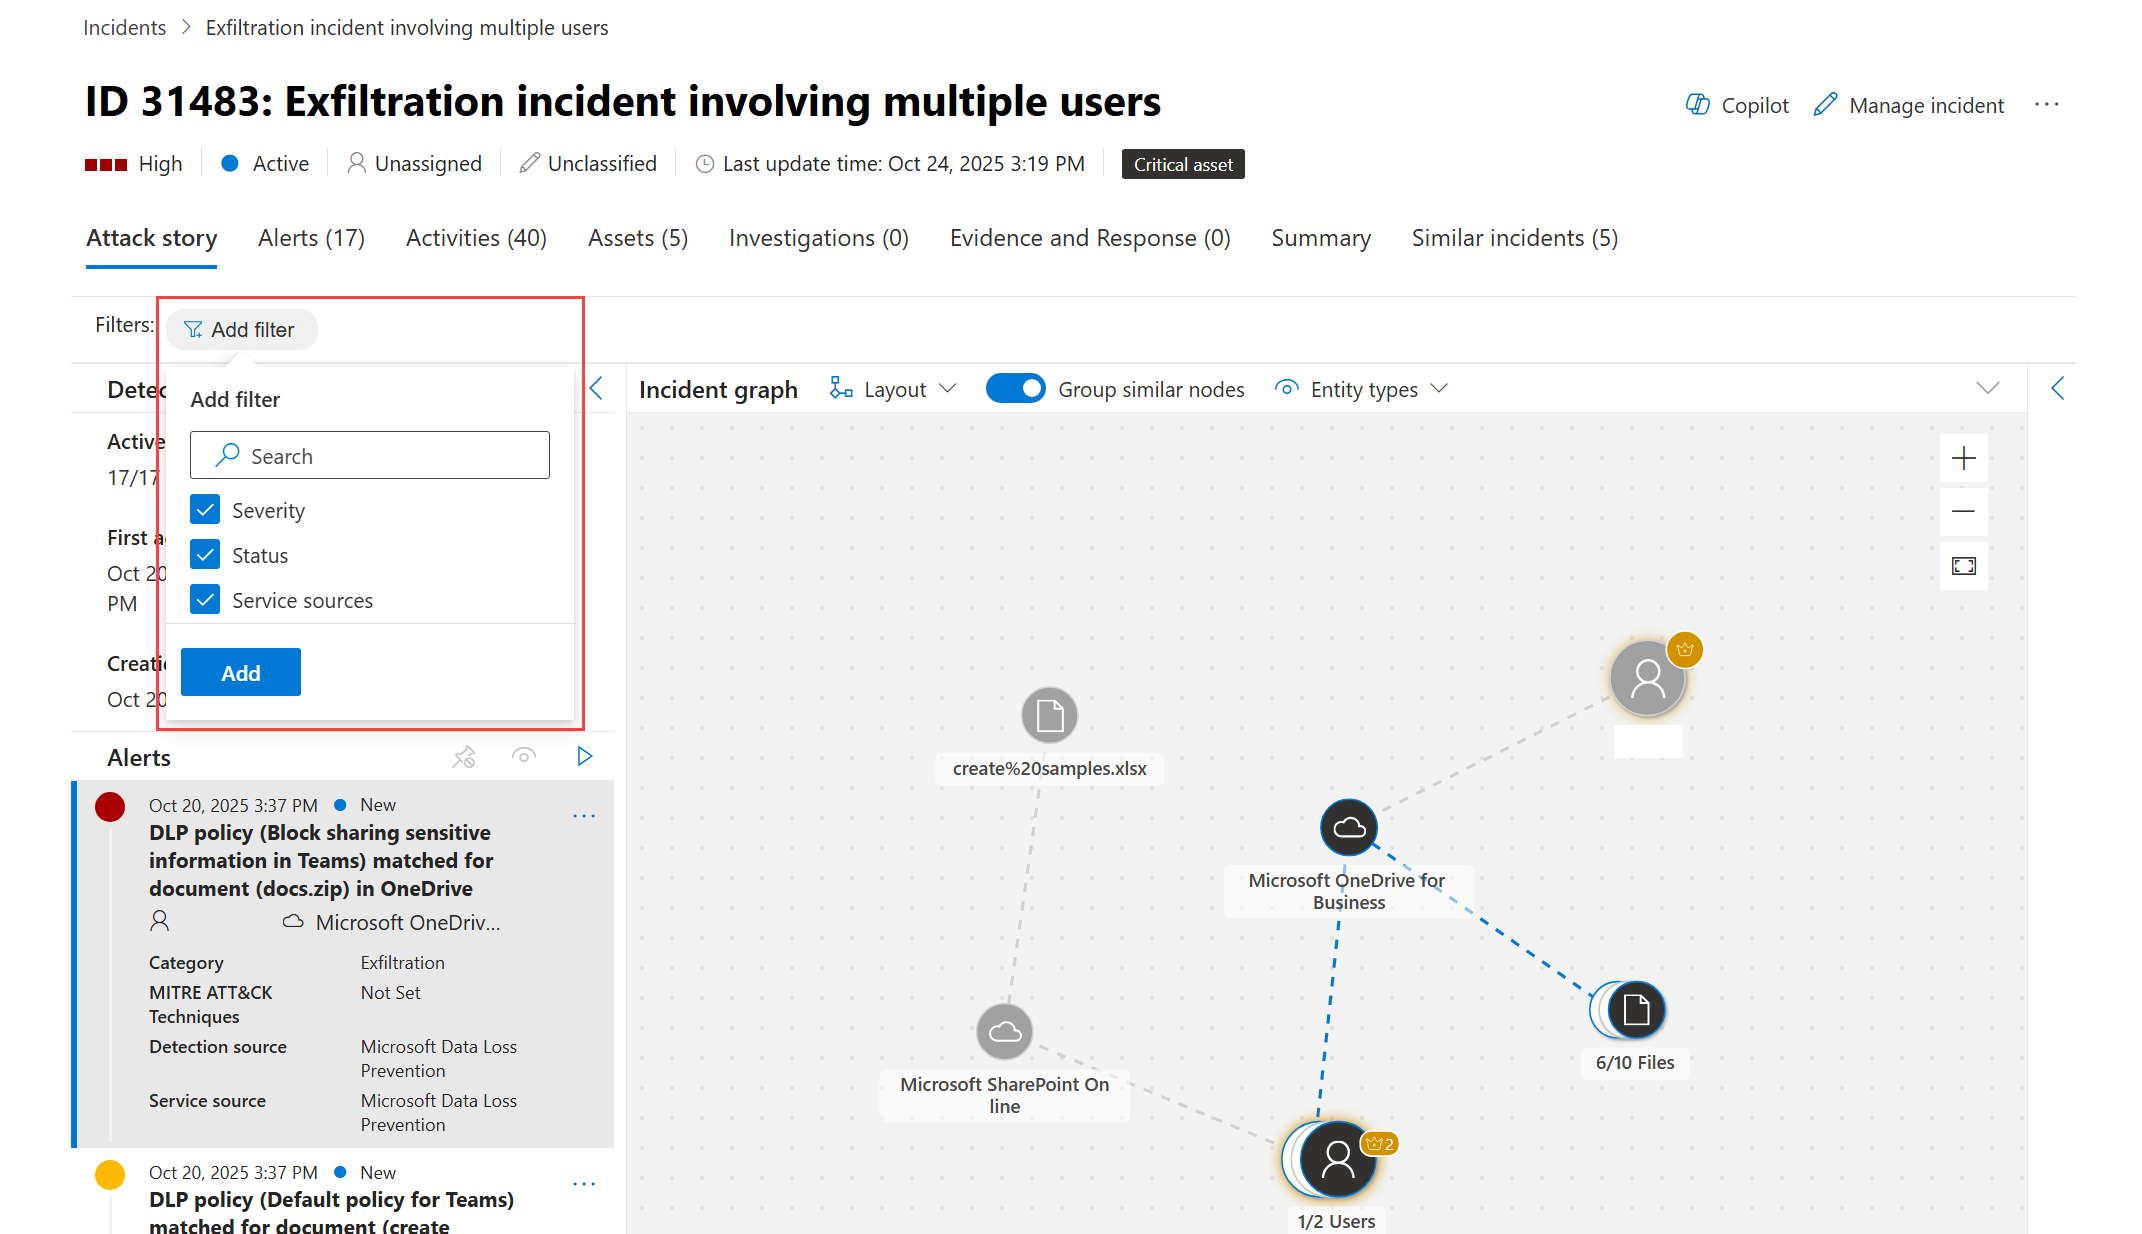
For each added filter criteria, choose the items you want to filter, and then select Apply.

Note
If all entities are filtered out, an empty state message appears. Adjust your filters to see relevant entities.


To hide specific entity types:
Select Entity types above the incident graph.
Uncheck the entity types you want to hide, such as file or user. The graph redraws itself without these entities.


Alerts
On the Alerts tab, you can view the alert queue for alerts related to the incident and other information about them, such as the following details:
- Severity of the alerts.
- The entities that were involved in the alert.
- The source of the alerts (Defender for Identity, Defender for Endpoint, Defender for Office 365, Microsoft Defender for Cloud Apps, and the app governance add-on).
- The reason the alerts link together.

By default, you see the alerts in chronological order so you can see how the attack played out over time. When you select an alert within an incident, Microsoft Defender XDR displays the alert information specific to the context of the overall incident.
You can see the events of the alert, which other triggered alerts caused the current alert, and all the affected entities and activities involved in the attack, including devices, files, users, cloud apps, and mailboxes.

For more information, see investigate alerts.
Note
If you have provisioned access to Microsoft Purview Insider Risk Management, you can view and manage insider risk management alerts and hunt for insider risk management events in the Microsoft Defender portal. For more information, see Investigate insider risk threats in the Microsoft Defender portal.
Activities
The Activities tab displays a unified timeline of all manual and automated actions that occur within an incident. You can filter by origin, category, provider, trigger, activity status, policy status, type, target name, target type, or performed by. You can also access this information as a side panel in the activity log.
By using the Activities tab, analysts can triage and investigate incidents. This process includes identifying key steps taken by humans and automated systems, verifying recent changes (such as tags, merges, severity updates), reviewing comments and handovers, inspecting detailed metadata in side panels, and following automated workflows launched by automation rules, playbooks, or agents.

Assets
Easily view and manage all your assets in one place by using the Assets tab. This unified view includes Devices, Users, Mailboxes, and Apps.
The Assets tab displays the total number of assets beside its name. When you select the Assets tab, you see a list of different categories with the number of assets within each category.

Devices
The Devices view lists all the devices related to the incident.

When you select a device from the list, you open a bar that you can use to manage the selected device. You can quickly export, manage tags, initiate automated investigation, and more.
You can select the check mark for a device to see details of the device, directory data, active alerts, and logged on users. Select the name of the device to see device details in the Defender for Endpoint device inventory.

From the device page, you can gather additional information about the device, such as all of its alerts, a timeline, and security recommendations. For example, from the Timeline tab, you can scroll through the device timeline and view all events and behaviors observed on the machine in chronological order, interspersed with the alerts raised.
Users
The Users view lists all the users that have been identified to be part of or related to the incident.

Select the check mark for a user to see details of the user account threat, exposure, and contact information. Select the user name to see additional user account details.
To learn how to view additional user information and manage the users of an incident, see investigate users.
Mailboxes
The Mailboxes view lists all the mailboxes that have been identified to be part of or related to the incident.

Select the check mark for a mailbox to see a list of active alerts. Select the mailbox name to see additional mailbox details on the Explorer page for Defender for Office 365.
Apps
The Apps view lists all the apps identified to be part of or related to the incident.

Select the check mark for an app to see a list of active alerts. Select the app name to see additional details on the Explorer page for Defender for Cloud Apps.
Cloud resources
The Cloud resources view lists all the cloud resources that are part of or related to the incident.

Select the check mark for a cloud resource to see the resource's details and a list of active alerts. Select Open cloud resource page to see additional details and to view its full details in Microsoft Defender for Cloud.
Investigations
The Investigations tab lists all the automated investigations triggered by alerts in this incident. Depending on how you configure automated investigations to run in Defender for Endpoint and Defender for Office 365, automated investigations perform remediation actions or wait for analyst approval of actions.

Select an investigation to navigate to its details page for full information on the investigation and remediation status. If any actions need approval as part of the investigation, they appear in the Pending actions tab. Take action as part of incident remediation.
The Investigation graph tab shows:
- The connection of alerts to the impacted assets in your organization.
- Which entities are related to which alerts and how they are part of the story of the attack.
- The alerts for the incident.
The investigation graph helps you quickly understand the full scope of the attack by connecting the different suspicious entities that are part of the attack with their related assets such as users, devices, and mailboxes.
For more information, see Automated investigation and response in Microsoft Defender XDR.
Evidence and Response
The Evidence and Response tab shows all the supported events and suspicious entities in the alerts in the incident.

Microsoft Defender XDR automatically investigates all the incidents' supported events and suspicious entities in the alerts, providing you with information about the important emails, files, processes, services, IP Addresses, and more. This helps you quickly detect and block potential threats in the incident.
Each analyzed entity is marked with a verdict (Malicious, Suspicious, Clean) and a remediation status. This information helps you understand the remediation status of the entire incident and what next steps you can take.
Approve or reject remediation actions
For incidents with a remediation status of Pending approval, you can approve or reject a remediation action, open in Explorer, or Go hunt from within the Evidence and Response tab.

Summary
Use the Summary page to assess the relative importance of the incident and quickly access the associated alerts and impacted entities. The Summary page gives you a snapshot glance at the top things to notice about the incident.

The information is organized into these sections.
| Section | Description |
|---|---|
| Alerts and categories | A visual and numeric view of how advanced the attack has progressed against the kill chain. As with other Microsoft security products, Microsoft Defender XDR is aligned to the MITRE ATT&CK™ framework. The alerts timeline shows the chronological order in which the alerts occurred and for each, their status and name. |
| Scope | Displays the number of impacted devices, users, and mailboxes. It lists the entities in order of risk level and investigation priority. |
| Alerts | Displays the alerts involved in the incident. |
| Evidence | Displays the number of entities affected by the incident. |
| Incident information | Displays the properties of the incident, such as tags, status, and severity. |
Similar incidents
Some incidents might have similar incidents listed on the Similar incidents page. This section shows incidents that have similar alerts, entities, and other properties. This similarity can help you understand the scope of the attack and identify other incidents that might be related.

Tip
Defender Boxed, a series of cards showcasing your organization's security successes, improvements, and response actions in the past six months or year, appears for a limited time during January and July of each year. Learn how you can share your Defender Boxed highlights.
Next steps
As needed, see the following resources:
See also
Tip
Do you want to learn more? Engage with the Microsoft Security community in our Tech Community: Microsoft Defender XDR Tech Community.