Note
Access to this page requires authorization. You can try signing in or changing directories.
Access to this page requires authorization. You can try changing directories.
Important
Some information in this article relates to a prereleased product which may be substantially modified before it's commercially released. Microsoft makes no warranties, expressed or implied, with respect to the information provided here.
This article shows you how to create and manage custom data collection rules in the Microsoft Defender portal.
Tip
Before creating custom collection rules, review Custom data collection to understand when and why to use this feature.
Prerequisites
Ensure you have:
| Requirement | Details |
|---|---|
| License | Microsoft Defender for Endpoint Plan 2 |
| Microsoft Sentinel workspace | Connected Microsoft Sentinel workspace (required for custom data storage) |
| Dynamic tags | Configured in Asset Rule Management and run at least once |
| Supported operating systems | • Windows 10 and 11 (minimum client version 10.8805; Windows 10 requires ESU enrollment) • Windows Server 2019 and later |
Important
Even if you have a connected Microsoft Sentinel workspace, you must select the workspace when creating custom data collection rules.
Performance and limits
- Each rule can capture up to 25,000 events per device per 24-hour rolling window
- When a device reaches the threshold, telemetry for that rule stops until the window resets
- Rule deployment typically takes 20 minutes to 1 hour
- Custom collection operates alongside default configuration without interference
Security considerations
Consider these security implications before creating rules:
| Consideration | Details | Recommendation |
|---|---|---|
| Rule scope impact | Overly broad rules generate large data volumes, increasing costs and making analysis difficult | Balance specificity with coverage by iterating and refining rules based on initial results |
| Too narrow rules | May miss important security events | Test with pilot groups and monitor for gaps in coverage |
| Performance considerations | Each device has a 25,000 event per rule per day limit | Use multiple focused rules rather than one overly broad rule; target rules carefully to devices where monitoring is essential |
| Testing strategy | Deploying rules without testing can lead to unexpected costs or missed events | 1. Start with a small pilot group (5-10 devices) 2. Monitor data volume and event quality for 24-48 hours 3. Refine conditions based on results 4. Gradually expand to larger device groups 5. Review cost and performance metrics regularly |
Data costs
- Custom data collection is included with Microsoft Defender for Endpoint P2
- Data ingestion into Microsoft Sentinel incurs charges based on your Sentinel billing
- Target collection to specific device groups to control costs
Create rules
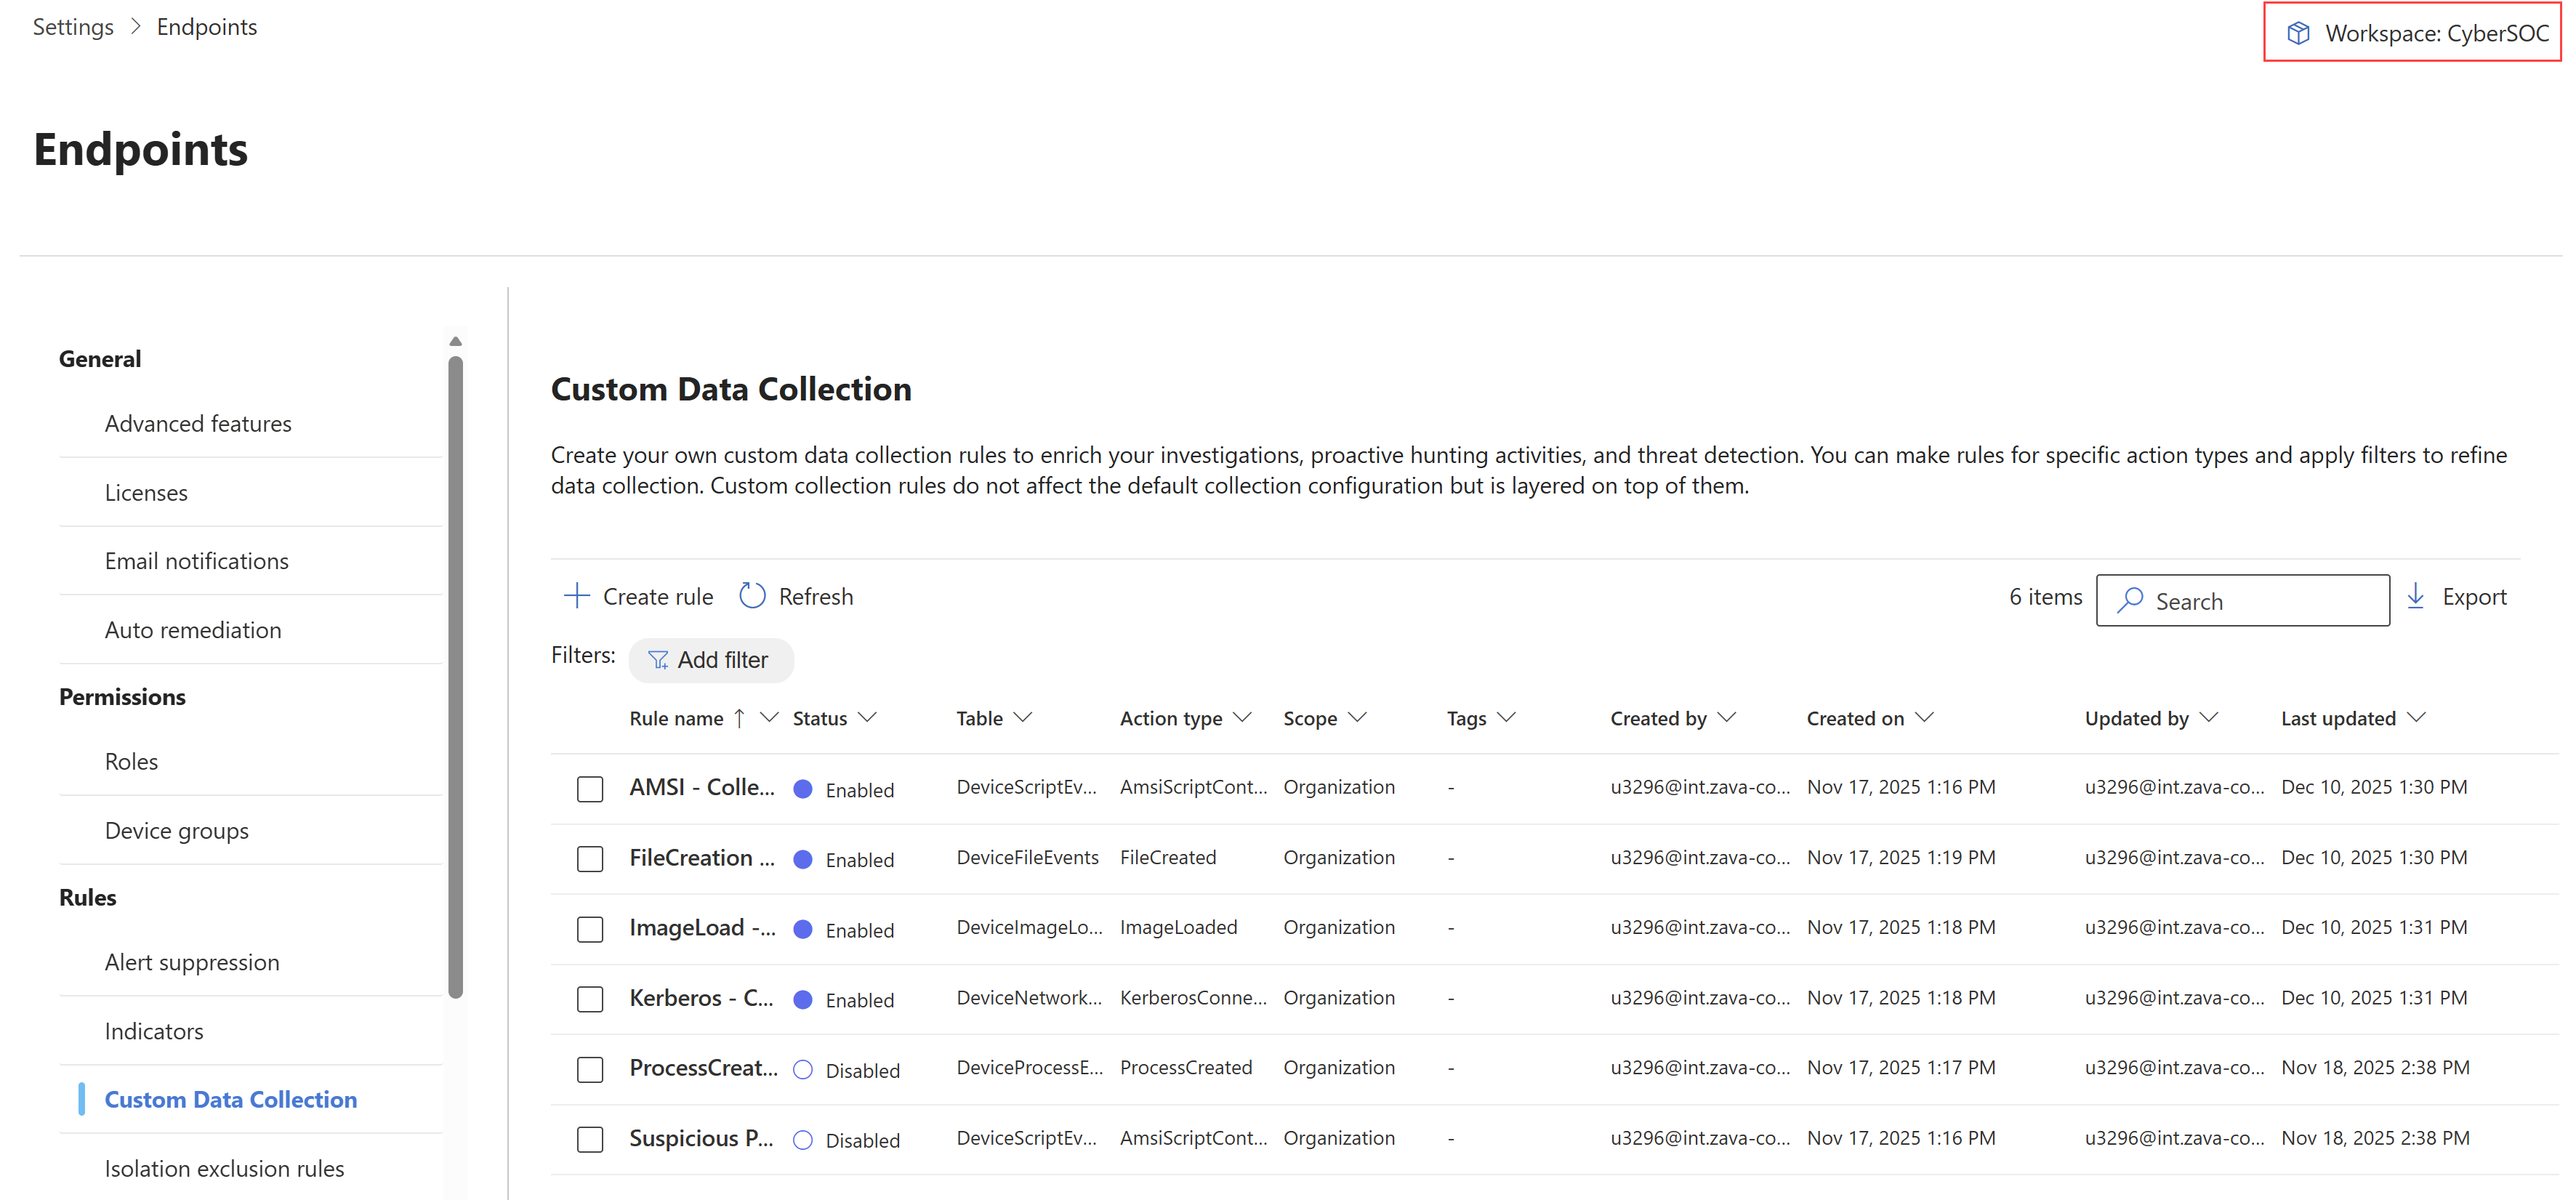
In the Microsoft Defender portal, navigate to Settings > Endpoints > Rules > Custom Data Collection.
To onboard your Microsoft Sentinel workspace, on the top right, select the Microsoft Sentinel workspace name.
In the Workspace scope page, select your workspace.
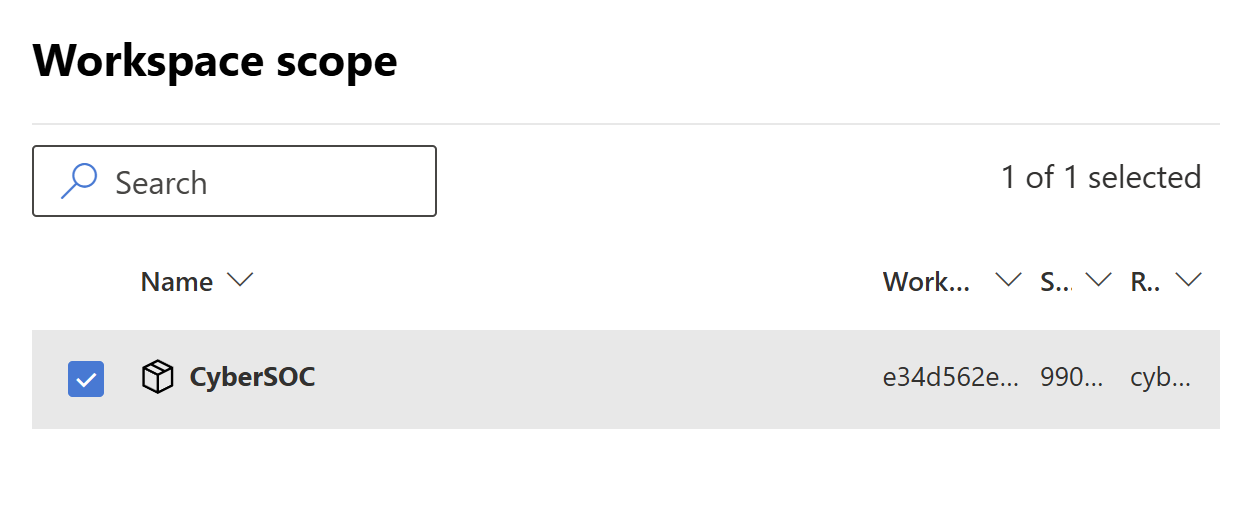
Note
You need to select the workspace at this stage, even if you already have a connected Microsoft Sentinel workspace.
Select Create rule. In the General Information section, type a rule name and description, and select Next.

In the Create rule section:
- Select which table you want to collect data from. For more information, see Supported event tables.
- Select the action for which you want to collect data.
- Add rule conditions to filter the data even further. You can add multiple conditions to refine the data collection. Rule conditions are based on the selected table. For more information, see the respective table link under Supported event tables.
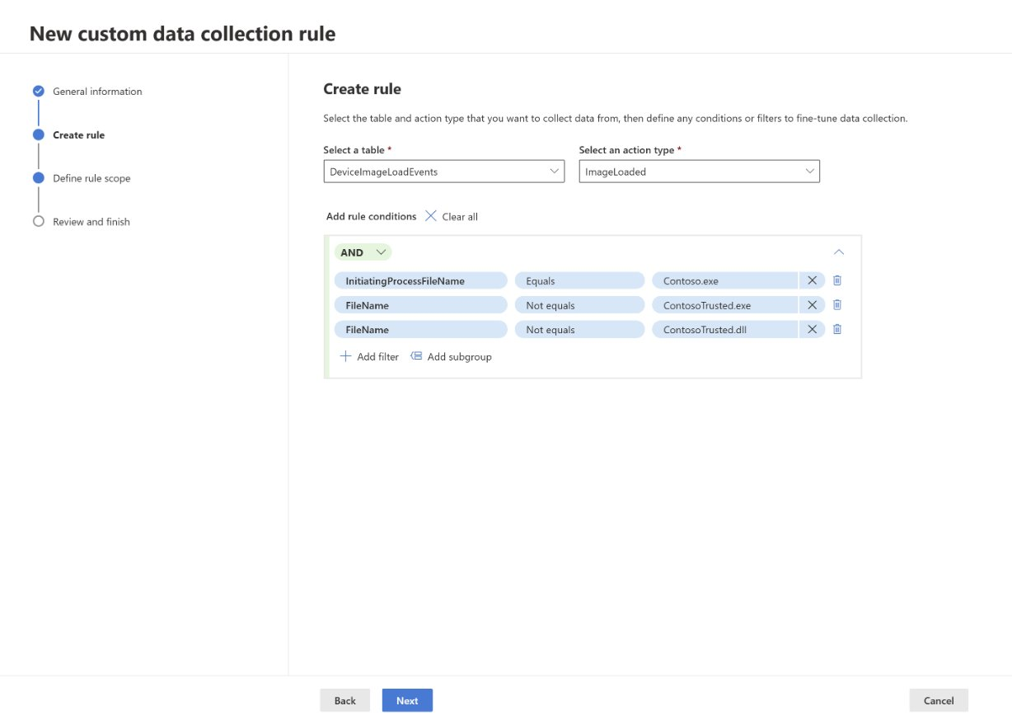
Select Next.
In the Define rule scope section, select whether you want to collect data from all applicable client devices or from specific devices that include dynamic tags. For more information, see Create dynamic rules for devices in asset rule management.
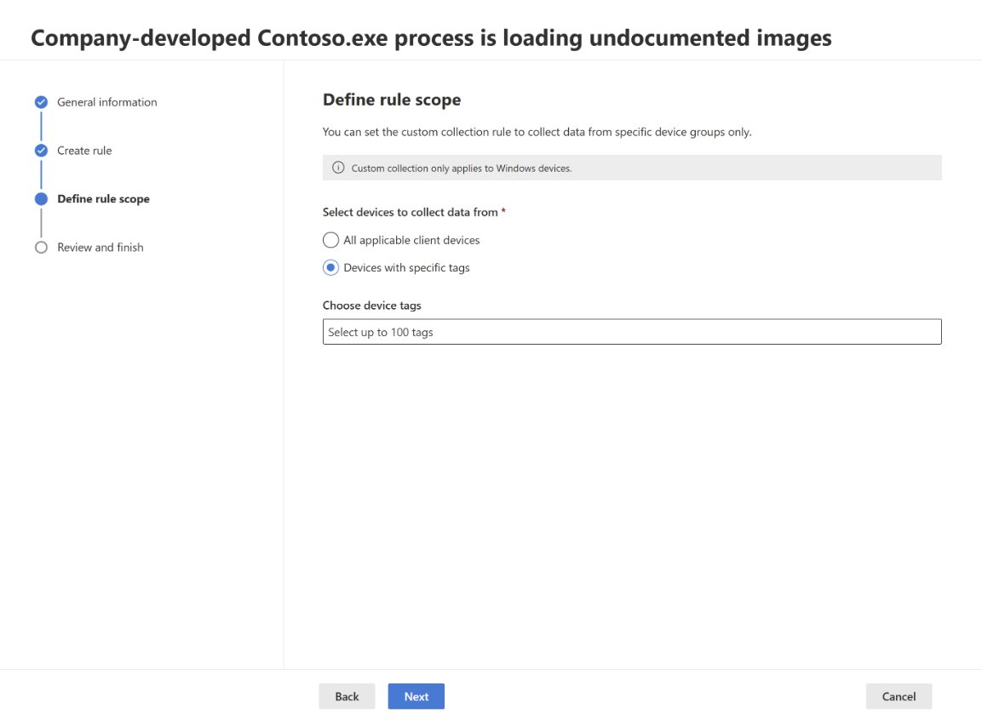
Note
Custom data collection only supports dynamic tags.
In the Review and finish section, review your rule settings, and select Submit.


It can take up to an hour for the rule to be deployed to the targeted devices.
Monitor and troubleshoot
After deploying custom data collection rules, monitor their performance and troubleshoot any issues.
Verify rule deployment
To check if a rule is collecting data from a specific device, query the custom event tables in advanced hunting:
search in (DeviceCustomFileEvents, DeviceCustomScriptEvents, DeviceCustomNetworkEvents, DeviceCustomProcessEvents, DeviceCustomImageLoadEvents) "your_device_id"
| where DeviceId == "your_device_id"
| summarize EventCount = count() by RuleName, RuleLastModificationTime, $table
| order by RuleLastModificationTime desc
Common issues and solutions
| Issue | Possible cause | Solution |
|---|---|---|
| No events collected | Rule not yet deployed | Wait up to 1 hour for deployment; check rule status in the portal |
| No events collected | Device not targeted correctly | Verify dynamic tag is applied to device and tag rule has run in Asset Rule Management |
| Events stopped collecting | 25,000 event limit reached | Review rule conditions to make them more specific; wait for 24-hour window to reset |
| Unexpected devices collecting data | Dynamic tag applied broadly | Review tag rules in Asset Rule Management; refine targeting criteria |
| Rule not visible on device | Device doesn't meet OS requirements | Check client version and OS version meet minimum requirements (Windows 10/11 version 10.8805+, Windows Server 2019+) |
| Custom collection not initializing | EDR exclusions may prevent collection | Check for EDR exclusions on target paths or processes; device reboots may be required if custom collection isn't initializing |
| Tags not updating | Dynamic tags haven't run recently | Dynamic tags update approximately every hour—check Last run time in Asset Rule Management |
Monitor rule performance
- Check event volume: Query custom event tables to see how many events each rule is collecting
- Review collection status: Monitor whether devices are approaching the 25,000 event per rule per day limit
- Validate targeting: Ensure rules are deploying to the correct devices based on your dynamic tags
Collect all events for testing
To collect all events from a specific table (for testing or comprehensive monitoring):
- Create a rule with the desired table
- Select all available actions
- Add a condition that's always true, such as:
- For network events:
RemotePort not equals 0 - For file events:
FileName not equals "" - For process events:
ProcessCommandLine not equals ""
- For network events:
- Target to a small pilot group first due to high data volume
Warning
Collecting all events generates very large data volumes and can quickly reach the 25,000 event per device limit. Use comprehensive collection only for testing or specific investigative purposes on a small number of devices.
Manage rules
Edit a rule
- Navigate to Settings > Endpoints > Rules > Custom Data Collection
- Select the rule you want to edit
- Select Edit
- Modify rule settings as needed (name, description, table, actions, conditions, or device targeting)
- Select Submit
Changes take effect on targeted devices within 20 minutes to 1 hour.
Enable or disable a rule
- In Custom Data Collection, select the rule
- Select or clear the Enable checkbox under the rule description
When you disable a rule, data collection stops on all targeted devices within the next agent check-in (typically within minutes to 1 hour).
Delete a rule
- In Custom Data Collection, select the rule
- Select Delete
- Confirm deletion
Important
Deleting a rule is permanent and cannot be undone. Historical data in Microsoft Sentinel remains available, but new collection stops immediately.
Next steps
- Custom data collection overview: Review capabilities and when to use custom collection
- Create and manage device tags and target devices: Learn how tags enable device targeting at scale
- Advanced hunting: Query custom event tables in Microsoft Sentinel