Note
Access to this page requires authorization. You can try signing in or changing directories.
Access to this page requires authorization. You can try changing directories.
This article helps you troubleshoot common scenarios in Durable Functions apps. Find your symptom in the following list and follow the linked steps to diagnose and resolve the issue.
Common symptoms
- Orchestration is stuck in the Pending state
- Orchestrations start after a long delay
- Orchestration is stuck in the Running state
- Orchestration takes longer than expected to complete
- Connection errors on the Consumption plan
For KQL diagnostic queries you can run in Application Insights, see Sample KQL queries for Durable Functions diagnostics.
Orchestration is stuck in the Pending state
When you start an orchestration, a "start" message is written to an internal queue managed by the Durable extension, and the status of the orchestration is set to "Pending". After an available app instance picks up and successfully processes the orchestration message, the status transitions to "Running" (or to some other non-"Pending" state).
Follow these steps to troubleshoot orchestration instances that remain stuck indefinitely in the "Pending" state.
Check the Durable Task Framework traces for warnings or errors for the affected orchestration instance ID. Use the Trace errors and warnings query in Application Insights to search for errors related to your instance.
Check the Azure Storage control queues to see if the orchestration's "start message" is still in the queue. In the Azure portal, navigate to your storage account, select Queues, and look for queues with a
controlprefix. For background on how control queues work, see the Azure Storage provider control queue documentation.Change your app's platform configuration to 64 Bit. Orchestrations sometimes fail to start because the app is running out of memory. Switching to a 64-bit process lets the app allocate more total memory. This change only applies to App Service Basic, Standard, Premium, and Elastic Premium plans. Free or Consumption plans do not support 64-bit processes.
Orchestrations start after a long delay
Normally, orchestrations start within a few seconds after they're scheduled. However, orchestrations might take longer to start in certain cases. Follow these steps to troubleshoot when orchestrations take more than a few seconds to start executing.
Check whether the delay matches a known limitation of the Azure Storage provider, such as partition rebalancing or timer-based polling intervals.
Check the Durable Task Framework traces for warnings or errors with the affected orchestration instance ID. Use the Trace errors and warnings query in Application Insights to search for errors related to your instance.
Orchestration is stuck in the Running state
If your orchestration status shows "Running" for longer than expected, or if it appears to have stopped making progress, the orchestration is likely waiting on a task that hasn't completed. For example, it could be waiting for a durable timer, an activity task, or an external event. If scheduled tasks completed successfully but the orchestration still isn't advancing, there might be a problem preventing it from proceeding to its next step. Orchestrations in this state are often called "stuck orchestrations".
Follow these steps to troubleshoot stuck orchestrations:
Try restarting the function app. This step can help if the orchestration gets stuck because of a transient bug or deadlock in either the app or the extension code.
Check the Azure Storage account control queues to see if any queues are growing continuously. Use the Azure Storage messaging query in Application Insights to identify problems with dequeuing orchestration messages. If the problem affects only a single control queue, it might indicate a problem on a specific app instance. In that case, scaling up or down to move off the unhealthy VM instance could help.
Filter the Azure Storage messaging query results by the queue name as the Partition ID to look for problems related to that specific control queue partition.
Check the Durable Functions Versioning documentation. Breaking changes to in-flight orchestration instances can cause stuck orchestrations.
Orchestration takes longer than expected to complete
Heavy data processing, internal errors, and insufficient compute resources can cause orchestrations to run slower than normal. Follow these steps to troubleshoot orchestrations that take longer than expected to complete:
Check the Durable Task Framework traces for warnings or errors for the impacted orchestration instance ID. Use the Trace errors and warnings query in Application Insights to search for errors related to your instance.
If your app uses the .NET in-process model, consider enabling extended sessions. Extended sessions minimize history loads, which can slow down processing.
Check for performance and scalability bottlenecks. High CPU usage or large memory consumption can cause delays. For detailed guidance, see Performance and scale in Durable Functions.
Sample KQL queries for Durable Functions diagnostics
Troubleshoot issues by writing custom KQL queries in the Azure Application Insights instance configured for your Azure Functions app. For column definitions used in these queries, see the column reference.
Azure Storage messaging
When you use the default Azure Storage provider, all Durable Functions behavior is driven by Azure Storage queue messages, and all state related to an orchestration is stored in table storage and blob storage. When you enable Durable Task Framework tracing, all Azure Storage interactions are logged to Application Insights. This data is critically important for debugging execution and performance problems.
Starting in v2.3.0 of the Durable Functions extension, you can publish these Durable Task Framework logs to your Application Insights instance by updating your logging configuration in the host.json file. For more information, see Durable Task Framework logging article.
The following query inspects end-to-end Azure Storage interactions for a specific orchestration instance. Edit start and orchestrationInstanceID to filter by time range and instance ID.
let start = datetime(XXXX-XX-XXTXX:XX:XX); // edit this
let orchestrationInstanceID = "XXXXXXX"; //edit this
traces
| where timestamp > start and timestamp < start + 1h
| where customDimensions.Category == "DurableTask.AzureStorage"
| extend taskName = customDimensions["EventName"]
| extend eventType = customDimensions["prop__EventType"]
| extend extendedSession = customDimensions["prop__IsExtendedSession"]
| extend account = customDimensions["prop__Account"]
| extend details = customDimensions["prop__Details"]
| extend instanceId = customDimensions["prop__InstanceId"]
| extend messageId = customDimensions["prop__MessageId"]
| extend executionId = customDimensions["prop__ExecutionId"]
| extend age = customDimensions["prop__Age"]
| extend latencyMs = customDimensions["prop__LatencyMs"]
| extend dequeueCount = customDimensions["prop__DequeueCount"]
| extend partitionId = customDimensions["prop__PartitionId"]
| extend eventCount = customDimensions["prop__TotalEventCount"]
| extend taskHub = customDimensions["prop__TaskHub"]
| extend pid = customDimensions["ProcessId"]
| extend appName = cloud_RoleName
| extend newEvents = customDimensions["prop__NewEvents"]
| where instanceId == orchestrationInstanceID
| sort by timestamp asc
| project timestamp, appName, severityLevel, pid, taskName, eventType, message, details, messageId, partitionId, instanceId, executionId, age, latencyMs, dequeueCount, eventCount, newEvents, taskHub, account, extendedSession, sdkVersion
Trace errors and warnings
The following query searches for errors and warnings for a given orchestration instance. Provide a value for orchestrationInstanceID.
let orchestrationInstanceID = "XXXXXX"; // edit this
let start = datetime(XXXX-XX-XXTXX:XX:XX);
traces
| where timestamp > start and timestamp < start + 1h
| extend instanceId = iif(isnull(customDimensions["prop__InstanceId"] ) , customDimensions["prop__instanceId"], customDimensions["prop__InstanceId"] )
| extend logLevel = customDimensions["LogLevel"]
| extend functionName = customDimensions["prop__functionName"]
| extend status = customDimensions["prop__status"]
| extend details = customDimensions["prop__Details"]
| extend reason = customDimensions["prop__reason"]
| where severityLevel >= 1 // to see all logs of severity level "Information" or greater.
| where instanceId == orchestrationInstanceID
| sort by timestamp asc
Control queue and partition ID logs
The following query searches for all activity associated with an instanceId's control queue. Provide the value for the instanceID in orchestrationInstanceID and the query's start time in start.
let orchestrationInstanceID = "XXXXXX"; // edit this
let start = datetime(XXXX-XX-XXTXX:XX:XX); // edit this
traces  // determine control queue for this orchestrator
| where timestamp > start and timestamp < start + 1h
| extend instanceId = customDimensions["prop__TargetInstanceId"]
| extend partitionId = tostring(customDimensions["prop__PartitionId"])
| where partitionId contains "control"
| where instanceId == orchestrationInstanceID
| join kind = rightsemi(
traces
| where timestamp > start and timestamp < start + 1h
| where customDimensions.Category == "DurableTask.AzureStorage"
| extend taskName = customDimensions["EventName"]
| extend eventType = customDimensions["prop__EventType"]
| extend extendedSession = customDimensions["prop__IsExtendedSession"]
| extend account = customDimensions["prop__Account"]
| extend details = customDimensions["prop__Details"]
| extend instanceId = customDimensions["prop__InstanceId"]
| extend messageId = customDimensions["prop__MessageId"]
| extend executionId = customDimensions["prop__ExecutionId"]
| extend age = customDimensions["prop__Age"]
| extend latencyMs = customDimensions["prop__LatencyMs"]
| extend dequeueCount = customDimensions["prop__DequeueCount"]
| extend partitionId = tostring(customDimensions["prop__PartitionId"])
| extend eventCount = customDimensions["prop__TotalEventCount"]
| extend taskHub = customDimensions["prop__TaskHub"]
| extend pid = customDimensions["ProcessId"]
| extend appName = cloud_RoleName
| extend newEvents = customDimensions["prop__NewEvents"]
) on partitionId
| sort by timestamp asc
| project timestamp, appName, severityLevel, pid, taskName, eventType, message, details, messageId, partitionId, instanceId, executionId, age, latencyMs, dequeueCount, eventCount, newEvents, taskHub, account, extendedSession, sdkVersion
Application Insights column reference for Durable Functions queries
The following table lists the columns projected by the preceding queries and their descriptions.
| Column | Description |
|---|---|
| pid | Process ID of the function app instance. This value is useful for checking if the process was recycled while an orchestration was running. |
| taskName | The name of the event being logged. |
| eventType | The type of message, which usually represents work done by an orchestrator. For a full list of possible values and their descriptions, see EventType.cs. |
| extendedSession | Boolean value indicating whether extended sessions are enabled. |
| account | The storage account used by the app. |
| details | Additional information about a particular event, if available. |
| instanceId | The ID for a given orchestration or entity instance. |
| messageId | The unique Azure Storage ID for a given queue message. This value most commonly appears in ReceivedMessage, ProcessingMessage, and DeletingMessage trace events. This value isn't present in SendingMessage events because the message ID is generated by Azure Storage after the message is sent. |
| executionId | The ID of the orchestrator execution, which changes whenever continue-as-new is invoked. |
| age | The number of milliseconds since a message was enqueued. Large numbers often indicate performance problems. An exception is the TimerFired message type, which might have a large Age value depending on the timer's duration. |
| latencyMs | The number of milliseconds taken by some storage operation. |
| dequeueCount | The number of times a message is dequeued. Under normal circumstances, this value is always 1. If it's more than one, there might be a problem. |
| partitionId | The name of the queue associated with this log. |
| totalEventCount | The number of history events involved in the current action. |
| taskHub | The name of your task hub. |
| newEvents | A comma-separated list of history events that are being written to the History table in storage. |
Connection management issues in the Consumption plan
Apps running on the Azure Functions Consumption plan are subject to connection limits. Common symptoms include:
- Intermittent connectivity errors when calling activity functions or external services.
- Orchestrations that fail sporadically under load.
- Socket exhaustion errors in the logs.
To reduce connection usage, use HttpClientFactory or shared static clients instead of creating new HttpClient instances in every function call. For detailed guidance on connection pooling and best practices, see Manage connections in Azure Functions.
General tips
Tip
Before diving into specific troubleshooting steps, ensure your app uses the latest Durable Functions extension version. Most of the time, using the latest version mitigates known issues already reported by other users. For instructions on how to upgrade, see Upgrade Durable Functions extension version.
The Diagnose and solve problems tab in the Azure portal can help monitor and diagnose issues related to your application and suggest potential solutions. For more information, see Azure Function app diagnostics.
Get support for Durable Functions issues
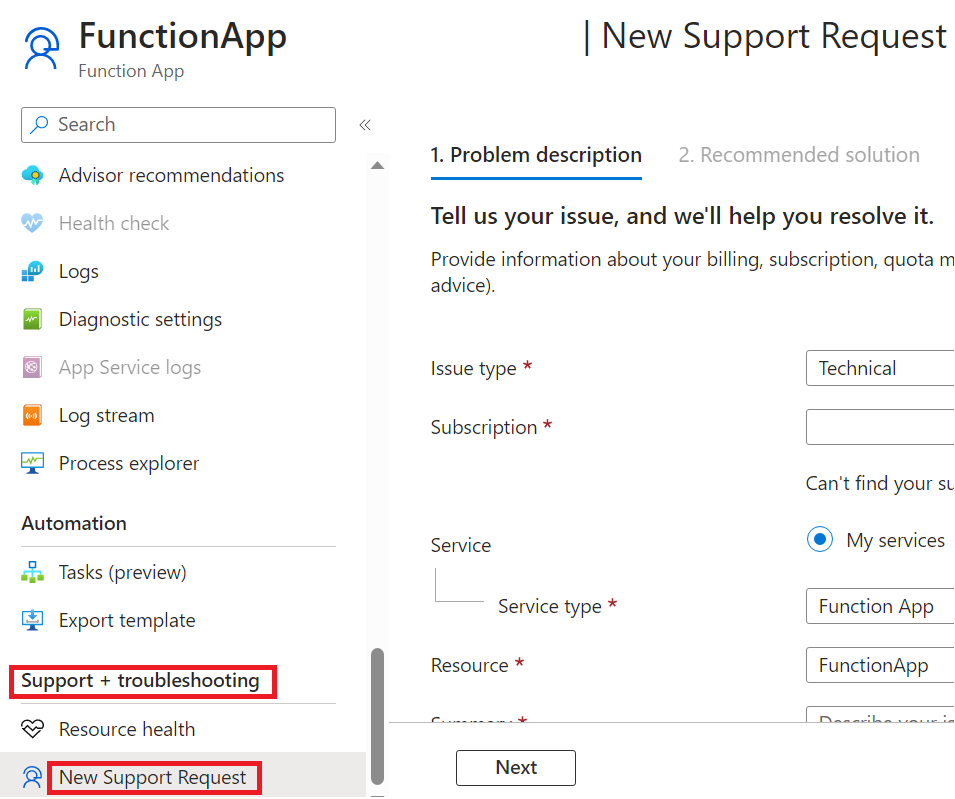
If you can't resolve your issue using this guide, you can file a support ticket by opening the New Support request blade in the Support + troubleshooting section of your function app page in the Azure portal.
For questions and community support, open an issue in one of the following GitHub repos. When you report a bug, include information like affected instance IDs, time ranges in UTC showing the problem, the application name (if possible), and deployment region to speed up investigations.