Note
Access to this page requires authorization. You can try signing in or changing directories.
Access to this page requires authorization. You can try changing directories.
This guide walks you through diagnosing and resolving real-world networking problems in Azure Kubernetes Service (AKS) using Advanced Container Networking Services (ACNS). Each playbook starts from a symptom (DNS failures, packet drops, traffic imbalance, L7 errors), shows you which signal to check first, and tells you when to drill into logs.
The guide is organized around tasks, not features. Read the mental model once, then jump straight to the playbook that matches your symptom.
What this guide helps you solve
- DNS resolution failures in pods (
NXDOMAIN,SERVFAIL, missing responses). - Packet drops caused by misconfigured network policies, connection tracking, or connectivity degradation.
- Traffic imbalance across pods or namespaces (hot pods, uneven load distribution).
- L7 application errors (HTTP 4xx/5xx, gRPC failures, Kafka drops).
- Cluster-wide network health monitoring and capacity planning.
- Observability cost control through targeted metric and log collection.
Mental model: how metrics, logs, and filtering fit together
ACNS gives you three signals. Each answers a different question.
| Signal | Answers | Best for | Where it lives |
|---|---|---|---|
| Container network metrics | What is happening, at what scale? | Anomaly detection, dashboards, alerts, capacity planning | Azure Managed Prometheus + Grafana |
| Container network logs (stored) (Cilium only) | Why did it happen? Which pods, what verdict? | Root-cause analysis, historical trends, compliance | Log Analytics workspace (ContainerNetworkLogs table), Azure portal dashboards, or any OpenTelemetry-compatible collector (Splunk, Datadog, etc.) |
| Container network logs (on-demand) (Cilium only) | What is happening right now? | Live debugging during an active incident | Hubble CLI, Hubble UI |
| Metrics filtering (Cilium only) | Which signals do I actually need? | Scoping collection to critical workloads, cost control | ContainerNetworkMetric CRD |
| Log filters and aggregation (Cilium only) | Which flows do I actually need? | Scoping log capture to critical traffic, cost control | ContainerNetworkLog CRD |
| Container Network Insights Agent (Preview) | Where do I even start? | AI-driven RCA across metrics, Hubble flows, Cilium policies, CoreDNS, and host-level NIC/kernel counters | In-cluster web app, accessed through the browser |
Note
Container Network Logs (stored and on-demand), the ContainerNetworkLog CRD, log filtering, and flow log aggregation all require the Cilium data plane. On non-Cilium clusters, use container network metrics for triage and rely on cluster-level networking telemetry for deeper investigation.
For a deeper feature reference, see Container network metrics, Container network logs, and Configure metrics filtering.
Standard troubleshooting flow
Use this loop for any network incident:
- Start in metrics dashboards. Confirm the anomaly: a spike in drops, errors, TCP resets, or DNS failures. Identify the affected node, namespace, or workload.
- Pivot to stored logs. Filter the
ContainerNetworkLogstable by the namespace and time window from step 1. Logs tell you the verdict, drop reason, source/destination workloads, and L7 status codes that metrics don't carry. - Reproduce live with on-demand logs. If the issue is intermittent or already fixed in stored data, use the Hubble CLI or Hubble UI to capture live flows for that workload.
- Validate the fix. Re-check the same metric panel and rerun the same KQL query. The anomaly should be gone.
- Tune collection. If you over-collected during the incident, narrow your
ContainerNetworkLogCRD or apply aContainerNetworkMetricfilter so you only capture what you need going forward.
Tip
Prefer to describe the problem instead of clicking through dashboards? Container Network Insights Agent (Preview) automates steps 1–3 by classifying your issue, collecting evidence through kubectl, Cilium, Hubble, CoreDNS, and host-level network statistics, and returning a structured RCA with remediation commands. It complements this guide rather than replacing it — the agent gives you a fast first pass; the playbooks here let you validate or go deeper. The agent is read-only; you still apply the fix yourself.
Note
ACNS metrics don't measure latency. Use Azure Monitor application performance metrics or your service mesh telemetry for latency analysis. ACNS surfaces traffic volume, drop counts, drop reasons, TCP states, TCP resets, DNS query/response counts and codes, and L4/L7 flow verdicts.
Built-in dashboards at a glance
Set these up once with Set up Container Network Observability. You'll reference them throughout the playbooks.
| Dashboard | Use when you need to... |
|---|---|
| Clusters | Get a fleet-wide view of bytes/packets forwarded and dropped per node. |
| DNS (Cluster) | Spot DNS issues across the whole cluster. |
| DNS (Workload) | Drill into DNS behavior for one Deployment/DaemonSet (for example, CoreDNS). |
| Drops (Workload) | See drop rate, drop reason, and direction for a specific workload. |
| Pod Flows (Namespace) | Find which pods in a namespace are sending or receiving the most traffic or drops. |
| Pod Flows (Workload) | Drill into L4/L7 flows for one workload, including TCP resets. |
| L7 Flows (Namespace / Workload) | Inspect HTTP, gRPC, and Kafka flows. Cilium data plane only, requires an L7 policy. |
| Flow Logs / Flow Logs (External Traffic) | Visualize stored container network logs in Azure portal or Grafana. |
Playbook 1: Diagnose DNS resolution failures
Symptom. Pods log errors like DNS_PROBE_FINISHED_NXDOMAIN, SERVFAIL, or hang while resolving service names.
Goal. Identify whether the failure is upstream (CoreDNS or external resolver), policy-driven (FQDN deny), or workload-specific.
Step 1: Confirm the anomaly in DNS metrics
Open the DNS (Cluster) dashboard. Look for sudden changes in request volume, response volume, or Requests Missing Response %. The summary panels surface the most common queries, the most common response codes, and the nodes generating the most errors.

What to look for: A sustained increase in error responses, a drop in successful responses, or a single node dominating the error count. Note the timestamp of the anomaly.
Step 2: Identify the noisiest pods
Scroll down on the same dashboard to the panel that ranks pods by DNS errors across all namespaces. The top entries are your starting suspects.

Decision point.
- If errors are concentrated in CoreDNS pods, jump to the DNS (Workload) dashboard with
kube-system / corednsselected — CoreDNS itself or its upstream resolver is the issue. - If errors are concentrated in an application workload, that workload is generating bad queries or being denied by an FQDN policy.
Step 3: Drill into the affected workload
Open the DNS (Workload) dashboard for the workload you identified.
DNS Requests / DNS Responses panels. A high Requests Missing Response % points at upstream timeouts or query overload.

DNS Errors by type. Match the spike to a code:
NXDOMAIN— wrong or stale domain name in app config.SERVFAIL— upstream resolver problem.- Query Refused — FQDN policy or DNS configuration mismatch.

DNS Response IPs Returned. Confirms successful resolution rate. A drop usually means CoreDNS can't reach upstream; a sudden surge can indicate a query storm.
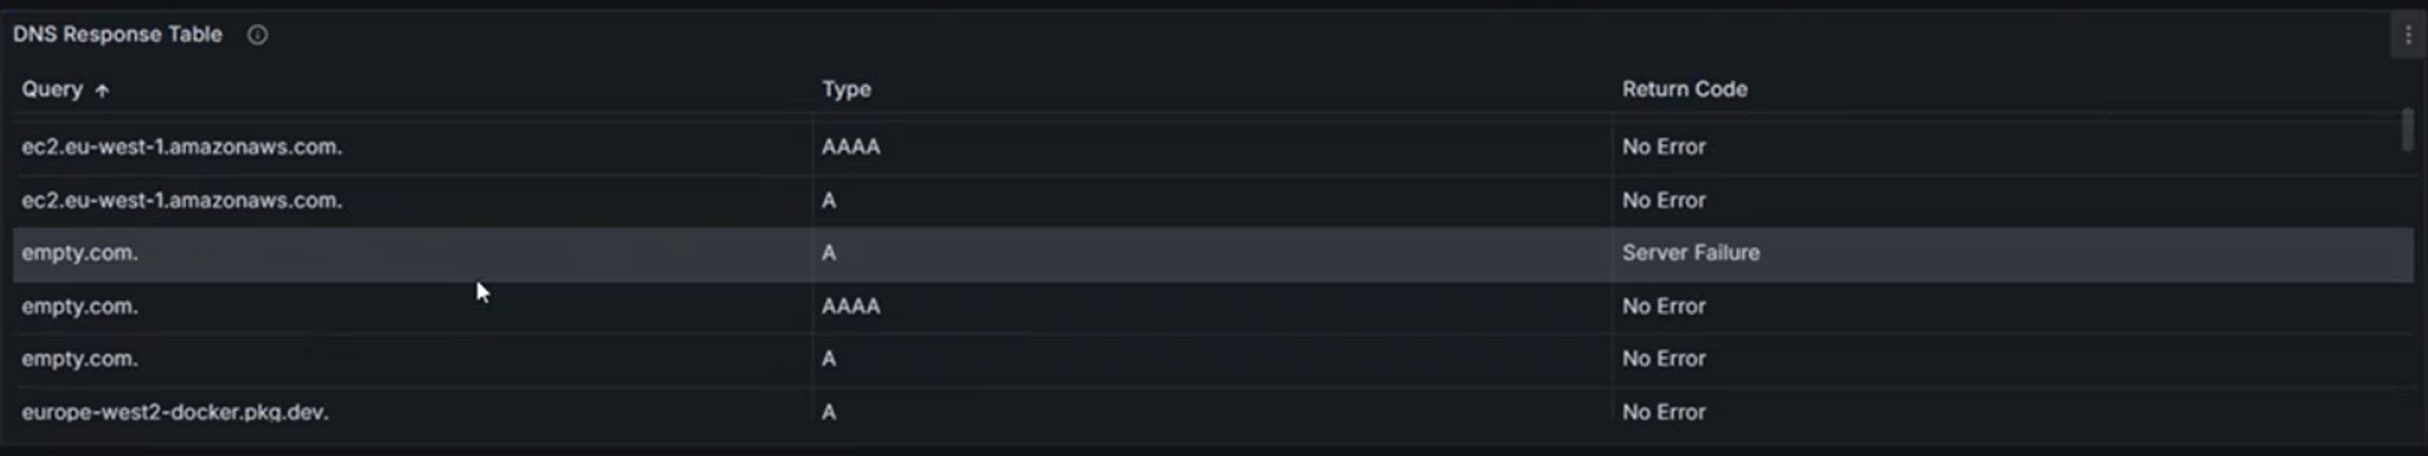
DNS Response Table. Use this to spot patterns like "A records fail but AAAA records succeed," which usually points at a stack misconfigured for IPv4-only environments.


Step 4: Confirm with stored logs
Run this KQL query in your Log Analytics workspace to surface DNS error patterns. Aggregated rows preserve Verdict, namespaces, workloads, and Layer7.dns.rcode, so this query works against the default (aggregated) ContainerNetworkLogs table:
ContainerNetworkLogs
| where TimeGenerated between (datetime(<start-time>) .. datetime(<end-time>))
| extend L4 = parse_json(Layer4), L7 = parse_json(Layer7)
| where L4.UDP.destination_port == 53
| where Reply == true
| extend SrcWorkload = tostring(SourceWorkloads[0].name),
         DstWorkload = tostring(DestinationWorkloads[0].name),
         DnsRcode    = tostring(L7.dns.rcode)
| where DnsRcode != "NOERROR"
| summarize ResponseCount = sum(IngressFlowCount + EgressFlowCount + UnknownDirectionFlowCount)
    by SourceNamespace, SrcWorkload, DestinationNamespace, DstWorkload, DnsRcode, Verdict
| order by ResponseCount desc
Replace <start-time> and <end-time> with timestamps in the format 2026-04-30T15:00:00Z.
What to check in the results:
- Verdict.
DROPPEDmeans an FQDN or network policy is blocking the query.FORWARDEDwith a non-NOERRORDnsRcode(for example,NXDOMAIN,SERVFAIL) means the upstream resolver returned an error. - Source/destination workloads. Confirm traffic is going to the expected CoreDNS workload.
DnsRcode. The DNS response code identifies the failure mode at a glance.
Note
The actual queried domain (Layer7.dns.query) and individual pod IPs aren't part of the aggregation key, so they're dropped from aggregated rows. To recover them, switch to on-demand logs (see Step 5).
You can also visualize the same flows in the Azure portal under AKS cluster > Insights > Networking > Flow Logs.

Step 5: Reproduce live if the issue is intermittent
If the spike already passed and you can't capture it in stored logs, use the Hubble CLI on demand:
hubble observe --namespace <ns> --port 53 --type l7 --follow

Step 6: Validate the fix
After updating the FQDN policy, fixing the application config, or scaling CoreDNS, re-open the DNS (Workload) dashboard. The error rate should drop within a minute or two. Rerun the KQL query for the same time window to confirm the failing queries are gone.
Note
DNS metrics on Cilium clusters require a Cilium FQDN network policy. See Configure an FQDN policy. On non-Cilium data planes, DNS metrics are collected by default.
Playbook 2: Investigate packet drops
Symptom. Services can't reach each other. Probes fail. Connections time out. Drop counters climb in dashboards.
Goal. Identify whether drops are caused by network policy, connection tracking exhaustion, or upstream connectivity problems — and which workload is responsible.
Step 1: Locate the drops at the namespace level
Open Pod Flows (Namespace). The heatmaps surface namespaces and pods with the highest outgoing and incoming drop rates.

Brighter cells indicate higher drop rates. Note the namespace and time window.
Step 2: Drill into the affected workload
Open Drops (Workload) and select the workload you identified.
Workload Snapshot shows max/min outgoing drops in packets/sec. Use it to gauge severity.

Dropped Traffic by Reason is the most important panel. The reason tells you what to fix:
- Policy denied — a NetworkPolicy or CiliumNetworkPolicy is blocking the traffic.
- CT: Map insertion failed — connection tracking table is full; scale node or reduce connection churn.
- Unsupported L3 protocol / Invalid packet — application or proxy is sending malformed traffic.

Heatmap of incoming/outgoing drops. Identifies which specific pod pairs are losing traffic.

Stacked Total Drops by Source Pod. Rank-orders the offenders so you know which replica to look at first.


Step 3: Confirm the dropped flows in stored logs
Find the exact source and destination workloads of the dropped traffic. Verdict, DropReason, namespaces, and workloads are all in the aggregation key, so this query works on aggregated data:
ContainerNetworkLogs
| where TimeGenerated between (datetime(<start-time>) .. datetime(<end-time>))
| where Verdict == "DROPPED"
| extend SrcWorkload = tostring(SourceWorkloads[0].name),
         DstWorkload = tostring(DestinationWorkloads[0].name)
| summarize DropCount = sum(IngressFlowCount + EgressFlowCount + UnknownDirectionFlowCount)
    by SourceNamespace, SrcWorkload, DestinationNamespace, DstWorkload, DropReason, bin(TimeGenerated, 5m)
| order by TimeGenerated desc, DropCount desc
Narrow to one namespace once you've identified it:
ContainerNetworkLogs
| where TimeGenerated between (datetime(<start-time>) .. datetime(<end-time>))
| where Verdict == "DROPPED"
| where SourceNamespace == "<namespace-name>"
| extend SrcWorkload = tostring(SourceWorkloads[0].name),
         DstWorkload = tostring(DestinationWorkloads[0].name)
| summarize DropCount = sum(IngressFlowCount + EgressFlowCount + UnknownDirectionFlowCount)
    by SrcWorkload, DestinationNamespace, DstWorkload, DropReason, TrafficDirection
| order by DropCount desc
The Flow Logs dashboard in the Azure portal shows the same data visually, including a service dependency graph that highlights blocked paths.

Step 4: Cross-check with policies
Once you know the source pod and destination pod:
kubectl get netpol,cnp -A
kubectl describe cnp -n <namespace> <policy-name>
Match the failed flow against ingress/egress rules. The most common cause is a default-deny policy added without an allow rule for a legitimate path.
Step 5: Validate the fix
After adjusting the policy, the Dropped Traffic by Reason chart should fall flat for policy denied. Rerun the KQL query — DROPPED verdicts for that source/destination pair should stop appearing.
Tip
If you're investigating an active incident and stored logs aren't enabled, run hubble observe --verdict DROPPED --namespace <ns> to stream drops live without changing any cluster configuration.
Playbook 3: Find traffic imbalances and hot pods
Symptom. A few pods of a Deployment are saturating CPU or network while others are idle. TCP resets climb. Latency reports come from users (latency itself isn't visible in ACNS metrics — see the note in Mental model).
Goal. Identify which pods are carrying disproportionate traffic and whether resets indicate overload or misconfigured load balancing.
Step 1: Compare pod-level traffic
Open Pod Flows (Workload). The Workload Snapshot summarizes outgoing/incoming traffic and drops.

The traffic-by-trace-type panel shows the shape of traffic over time. A wide gap between outgoing and incoming volume often points at a downstream bottleneck.

Step 2: Spot hot pods with heatmaps
The pod-level heatmaps make imbalance obvious. If one pod (for example, default/tcp-client-0) appears in both the outgoing and incoming heatmaps with much darker cells than its replicas, traffic is concentrated there.

Common causes:
- Service
sessionAffinity: ClientIPpinning clients to one pod. - Headless service with sticky DNS resolution.
- External load balancer hashing on a low-cardinality field.
Step 3: Use TCP resets as a saturation signal
Open the TCP reset metrics panels.

Heatmap of Outgoing TCP RST by Source Pod. A hot source pod that also generates RSTs is overloaded — the application is closing connections aggressively.

Heatmap of Incoming TCP RST by Destination Pod. A pod receiving RSTs from many sources usually means it can't accept new connections fast enough (backlog full, listener slow).

Stacked Total RST by Source/Destination. Trends over time tell you whether resets are an incident or a new steady state.


Step 4: Confirm with logs
Identify the busiest workloads by total flow volume. Use the aggregated flow-count columns rather than count(), which only counts aggregated rows, not the underlying flows:
ContainerNetworkLogs
| where TimeGenerated between (datetime(<start-time>) .. datetime(<end-time>))
| extend SrcWorkload = tostring(SourceWorkloads[0].name)
| summarize TotalFlows = sum(IngressFlowCount + EgressFlowCount + UnknownDirectionFlowCount)
    by SourceNamespace, SrcWorkload
| top 10 by TotalFlows desc
Note
Per-packet TCP flags (such as RST) aren't part of the aggregation key, so they're dropped from aggregated rows in ContainerNetworkLogs. To investigate TCP resets at the flow level, use the TCP reset dashboards above plus the on-demand logs path — stream live RST flows with hubble observe --type trace --verdict FORWARDED --tcp-flags RST.
Step 5: Validate the fix
After scaling the workload, rebalancing the service, or fixing affinity rules, the heatmap should brighten across more pods evenly and the TCP RST rate should fall.
Playbook 4: Monitor cluster-wide network health
Use this when you need a fleet view: capacity planning, on-call dashboards, or a quick health check across many clusters.
Open Kubernetes / Networking / Clusters.

Signals to watch and what they mean:
| Panel | Watch for | Likely cause |
|---|---|---|
| Bytes / Packets Forwarded | Sudden cliffs or spikes | Bottleneck or workload restart |
| Bytes / Packets Dropped (cluster) | Sustained climb | Policy regression or saturated link |
| Bytes / Packets Dropped by Reason | New reason appearing | New misconfiguration or kernel-level issue |
| Bytes / Packets Dropped by Node | Single node dominating | Node-local hardware, misconfig, or noisy neighbor |
| TCP connection state distribution | Excess SYN_SENT or TIME_WAIT |
Connectivity failures or socket churn from short-lived connections |


When something on this dashboard looks wrong, jump to the matching playbook (Playbook 1 for DNS, Playbook 2 for drops, Playbook 3 for hot pods).
Playbook 5: Diagnose application-layer (L7) errors
Symptom. HTTP 4xx/5xx error rates climb. gRPC calls fail. Kafka consumers lag. Available on Cilium clusters with L7 policy enforcement enabled and a CiliumNetworkPolicy that includes L7 rules — see Configure a Layer 7 policy.
Goal. Identify whether L7 errors come from misconfigured clients, server-side failures, or denied flows.
Note
L7 enforcement requires the cluster to be created or updated with --acns-advanced-networkpolicies L7. The L7 setting also enables FQDN filtering. L7 rules aren't supported in CiliumClusterwideNetworkPolicy (CCNP), and L7 traffic flows through an Envoy proxy that can add latency above ~3,000 requests per second per node. See L7 policy considerations.
Step 1: Open the L7 dashboard
Use Kubernetes / Networking / L7 (Workload) for a single service or L7 (Namespace) for a whole tenant.

Step 2: Separate dropped vs forwarded HTTP traffic
The verdict panel splits HTTP traffic into forwarded and dropped flows. A spike in dropped HTTP usually means a CiliumNetworkPolicy is denying the request at L7 (for example, blocking a path or method).

Step 3: Track status codes over time
The status-code panel tells you whether errors are client-side or server-side. A surge in 4xx points to bad input, expired tokens, or denied paths. A surge in 5xx points at backend failures.

Step 4: Find the offending pods
The 4xx heatmap shows which source pods are generating the most failed requests. A single pod glowing brightly usually means a stuck client retry loop or a misconfigured replica.


Step 5: Confirm with KQL
Pull HTTP traffic broken down by status code. Layer7.http.code is part of the aggregation key, so this works against aggregated rows:
ContainerNetworkLogs
| where TimeGenerated between (datetime(<start-time>) .. datetime(<end-time>))
| extend L7 = parse_json(Layer7)
| where isnotnull(L7.http)
| extend StatusCode  = tostring(L7.http.code),
         SrcWorkload = tostring(SourceWorkloads[0].name),
         DstWorkload = tostring(DestinationWorkloads[0].name)
| where StatusCode startswith "4" or StatusCode startswith "5"
| summarize ErrorFlows = sum(IngressFlowCount + EgressFlowCount + UnknownDirectionFlowCount),
            UniqueCodes = dcount(StatusCode)
    by SrcWorkload, DstWorkload, StatusCode
| order by ErrorFlows desc
For gRPC and Kafka, Layer7 carries the protocol-specific payload but only http.code and dns.rcode are aggregation keys. Filter on Verdict and the workload identity, and use on-demand logs when you need the gRPC method or Kafka topic:
ContainerNetworkLogs
| where TimeGenerated between (datetime(<start-time>) .. datetime(<end-time>))
| where FlowType == "L7"
| extend SrcWorkload = tostring(SourceWorkloads[0].name),
         DstWorkload = tostring(DestinationWorkloads[0].name)
| where Verdict == "DROPPED"
| summarize DroppedFlows = sum(IngressFlowCount + EgressFlowCount + UnknownDirectionFlowCount)
    by SrcWorkload, DstWorkload
| order by DroppedFlows desc
Note
Fine-grained L7 attributes (HTTP URLs, gRPC methods, Kafka topics, DNS query names) aren't in the aggregation key and are dropped from aggregated rows. Use on-demand Hubble flows for that level of detail.
What to focus on during L7 RCA
- Traffic volume and shape. Use heatmaps to find imbalance; one hot replica often explains the error rate.
- Status code trend. 4xx vs 5xx narrows the investigation to the client or server side.
- Verdict. Dropped L7 flows mean an L7 policy is rejecting the request — read the policy and confirm intent.
Feature deep dive (when to use what)
Use this section as a quick reference once you know the playbooks.
Container network metrics
- Use for: anomaly detection, dashboards, alerting, capacity planning.
- Skip for: root cause that needs identity (which pod, which path, which verdict).
- Granularity: node-level on all data planes; pod-level on Linux.
- Cost-sensitive workloads: apply metrics filtering on Cilium clusters to keep only the namespaces, labels, and metric types you care about. Filtering happens before scrape, so unwanted series never reach Prometheus.
Container network logs (stored)
Use for: root-cause analysis, historical trends, compliance/audit.
Data plane: Cilium only. Stored logs aren't available on non-Cilium clusters.
Mandatory step: define a
ContainerNetworkLogCRD that selects the traffic you want. Without it, no logs are collected. See Set up container network logs.Where logs land: by default, Cilium writes flow records to
/var/log/acns/hubble/events.logon each node (50 MB rotating buffer). From there you have two storage paths:- Azure Log Analytics (managed, recommended) — Container Insights ships logs into the
ContainerNetworkLogstable for KQL queries and built-in Azure portal dashboards. - Bring your own collector — point an OpenTelemetry-compatible agent (Splunk, Datadog, Elastic, any OTel collector) at the host log path to forward flows into your existing observability stack instead of, or in addition to, Log Analytics.
- Azure Log Analytics (managed, recommended) — Container Insights ships logs into the
Cost control: flow log aggregation collapses similar flows over a 30-second window, preserving patterns while cutting volume. Combine with narrow
includeFiltersfor the best results.Visualization: use the Flow Logs - Analytics Tier or Flow Logs - Basic Tier dashboards under Azure > Insights > Containers > Networking.


Container network logs (on-demand)
Use for: live incidents, intermittent issues, ad-hoc investigation without changing collection config.
Data plane: Cilium only.
Tools: Hubble CLI for terminal filtering; Hubble UI for visual service-to-service maps.
No persistent storage, no extra cost, no setup beyond enabling ACNS.


Metrics filtering (Cilium clusters)
Apply a ContainerNetworkMetric CRD to control which Hubble metrics are exported per node. Useful when you need broad observability on a few critical namespaces but don't want to pay for high-cardinality flow series across all of them.
Common patterns:
- Keep DNS and drop metrics cluster-wide; restrict flow metrics to production namespaces.
- Exclude high-volume system namespaces like
kube-systemfrom flow metrics. - Scope per-tenant namespaces to their own filter blocks.
For full CRD examples, see Configure container network metrics filtering.
Best practices
- Start broad, then narrow. Enable broad logs/metrics for a few days, review what you actually use, then tighten
ContainerNetworkLogandContainerNetworkMetricfilters. - Keep metric and log time windows aligned. When you investigate an incident, use the same start/end time across the dashboard and the KQL query so signals correlate cleanly.
- Prefer the pre-built dashboards. They cover the most common questions. Custom panels are usually only needed once you're past initial triage.
- Tier
ContainerNetworkLogsby need. Switch to the Basic tier for cost-sensitive workloads; use the matching Basic-tier dashboard. See Log Analytics table plans. - Treat aggregated logs and on-demand logs as complements. Aggregated logs are great for trend and pattern detection but skip per-flow detail. Use on-demand (Hubble) for fine-grained inspection.
- Validate fixes with the same panel that surfaced the issue. If the same panel goes flat after your change, you have a real fix.
Common pitfalls
- Forgetting the
ContainerNetworkLogCRD. Enabling Container Network Logs in the cluster doesn't collect anything until you apply at least one CRD that selects traffic. - Trying to use stored logs for live incidents that already passed. If logs weren't enabled before the incident or fell outside the captured filter, switch to on-demand Hubble flows for the next occurrence.
- L7 dashboards empty on a Cilium cluster. L7 metrics require both
--acns-advanced-networkpolicies L7on the cluster and aCiliumNetworkPolicywith L7 rules. CCNP doesn't support L7 rules. See Apply L7 policies. - DNS metrics empty on Cilium. DNS visibility requires a
CiliumNetworkPolicywith adnsrule (typically alongsidetoFQDNs). FQDN/DNS proxy is not compatible with node-local DNS or AKS Local DNS — running either disables DNS proxying and the resulting metrics. See FQDN filtering limitations. matchPattern: "*"blocks all DNS. A bare wildcard isn't supported. Use a leading-wildcard pattern such as*.example.comorapp*.example.com. See Apply FQDN filtering policies.
Network Observability included with Azure Monitoring
When you enable Azure Monitor managed service for Prometheus on an AKS cluster, basic node network monitoring metrics are collected by default through the networkobservabilityRetina target. This provides:
- Basic node-level network metrics: Essential network traffic visibility at the node level
- Default Prometheus targets: Network observability metrics automatically scraped by Azure Monitor
- Azure Monitor integration: Seamless integration with Azure Monitor; metrics are automatically collected and can be visualized in Grafana
- No additional setup required: Automatically enabled when Azure Monitor managed Prometheus is configured
- Microsoft support: Supported as part of Azure Monitor and AKS
Note: This requires Azure Monitor managed service for Prometheus to be enabled on your AKS cluster, which may have associated costs.
Getting started: Enable Azure Monitor managed service for Prometheus on your AKS cluster through Azure portal or CLI. Network observability metrics will be automatically collected and available for visualization in Azure Managed Grafana.
Network observability with Retina OSS
While Advanced Container Networking Services (ACNS) is a paid offering that provides comprehensive network observability capabilities, Microsoft also supports Network observability with Retina OSS, an open-source network observability platform that provides essential network monitoring capabilities.
Retina OSS is the open-source observability platform available at retina.sh and GitHub. It provides:
- eBPF-based network observability: Uses eBPF technologies to collect insights with minimal overhead
- Deep traffic analysis with Kubernetes context: Comprehensive capture and analysis of network traffic flows with full Kubernetes integration
- Advanced metrics collection: Layer 4 metrics, DNS metrics, and distributed packet capture capabilities
- Plugin-based extensibility: Customize and extend functionality through a plugin architecture
- Prometheus-compatible metrics: Export comprehensive network metrics in Prometheus format with configurable metric modes
- Distributed packet capture: On-demand packet captures across multiple nodes for deep troubleshooting
- Platform and CNI agnostic: Works with any Kubernetes cluster (AKS, Arc-enabled, on-premises), any OS (Linux/Windows), and any CNI
- Community support: Open-source with community-driven support and contributions
- Self-managed: Complete control over deployment and configuration
- Hubble integration: Integrates with Cilium's Hubble for additional network insights
Getting started: Deploy Retina OSS using Helm charts or Kubernetes manifests from the official Retina repository. Set up Prometheus and Grafana to visualize metrics, configure deep traffic analysis with Kubernetes context, enable distributed packet capture for advanced troubleshooting, and customize functionality using the plugin-based architecture for specific use cases.
Comparison of network observability offerings
| Offering | Support | Cost | Management | Deployment | Use Cases |
|---|---|---|---|---|---|
| Advanced Container Networking Services (ACNS) | Microsoft enterprise support | Paid Azure service | Fully managed by Microsoft | One-click Azure integration | Managed enterprise observability: Pod-level network flows, pod-level metrics, DNS metrics, persistent stored logs, Layer 7 traffic analysis, network security policy enforcement, compliance reporting, advanced Grafana dashboards, AI-powered insights |
| Network Observability (Azure Monitor) | Microsoft support as part of Azure Monitor | Included with Azure Monitor managed Prometheus (Azure Monitor costs apply) | Fully managed by Microsoft | Automatic when Azure Monitor managed Prometheus is enabled | Node network monitoring: Cluster and node-level network metrics only, no pod-level visibility, no stored logs, no DNS analysis - suitable for basic infrastructure monitoring and users who want minimal network observability without additional configuration |
| Retina OSS | Community support | Free and open-source | Self-managed | Manual setup via Helm/manifests on any Kubernetes cluster | Unmanaged advanced observability: Real-time packet captures, custom metrics collection, eBPF-based deep network analysis, Hubble integration, multicloud deployments, custom observability pipelines, advanced debugging with tcpdump/Wireshark integration, and development/testing environments |
Learn More
Advanced Container Networking Services (ACNS)
- Platform overview: What is Advanced Container Networking Services for AKS?
- Set up observability: Set up Container Network Observability
- Container network metrics: Container network metrics overview
- Container network logs: Container network logs overview and Set up container network logs
- Metrics filtering (Cilium): Configure container network metrics filtering
AI-driven diagnostics
- Container Network Insights Agent (Preview): Overview and Set up the agent
- AKS MCP server: AKS Model Context Protocol server
Container Network Security (Cilium)
- FQDN filtering: Concepts and Apply FQDN filtering policies
- Layer 7 policy: Concepts and Apply L7 policies
- Mutual TLS (Cilium): Concepts and Configure mutual TLS
- In-transit encryption: WireGuard encryption concepts
Data plane and platform
- Azure CNI powered by Cilium: Configure Azure CNI powered by Cilium
- eBPF host routing performance: Container network performance with eBPF host routing
- Log Analytics table plans: Choose a table plan based on data usage
Open-source tooling
- Retina: retina.sh and the Microsoft Retina GitHub repository
- Hubble (Cilium project): Hubble documentation