Bemærk
Adgang til denne side kræver godkendelse. Du kan prøve at logge på eller ændre mapper.
Adgang til denne side kræver godkendelse. Du kan prøve at ændre mapper.
Azure DevOps Services | Azure DevOps Server | Azure DevOps Server 2022
This article provides ready-to-use query chart examples that you can adapt for your dashboards. Each example includes the query clauses and chart configuration so you can recreate them in your own project.
The examples are organized into three categories:
- Backlog hygiene — Spot unassigned, stale, or incomplete work items
- Status charts — Show current state of bugs, planned work, and blocked items
- Trend charts — Track how bug counts and active work change over time
To create and configure query charts, see Track progress with status and trend query-based charts. Keep these tips in mind when building the queries behind your charts:
- Use Flat list of work items — only flat-list queries support charts.
- Use In and Not In operators to group multiple work item types or states.
- Limit trend chart queries to 1,000 work items to avoid widget errors.
- Add grouping fields (State, Assigned To, Iteration Path, or custom fields) to your query clauses or column options.
- Save the query under Shared Queries before adding the chart to a dashboard.
- You can't group charts by ID, Date-time, Plain Text, Rich-text, or Tags fields. To group by tags, use the Chart for Work Items widget instead.
Note
Work item types and workflow states in these examples might differ from yours depending on the process your project uses. Replace Fabrikam Team with your team name and adjust filters as needed.
Backlog hygiene
Review these queries periodically — typically at the start or end of a sprint — to keep your backlog healthy.
Query focus
Query clauses
Unassigned work: Work assigned to the current sprint but not assigned to a team member.

Active work not assigned to the current sprint

Active work assigned to a past sprint

Stale work: Work items with no changes made in the last two to three months (query by Changed Date).

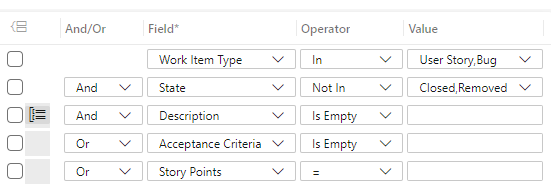
Ill-defined work: Items missing Description, Acceptance Criteria, Story Points, or Effort.
The following image shows all five charts on a team dashboard. To add charts, see Add charts to a dashboard.

You can also use query tiles that show the total count for each query.
Tip
Query tiles are 1x1 widgets, while query charts are at least 2x2. To add query tiles, see Add widgets to a dashboard.

Example status charts
Status charts show a point-in-time snapshot of work. The following examples show common queries and charts.
Query focus
Query clauses
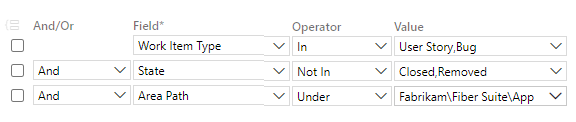
Planned work: Work in the New or Proposed category state — a snapshot of items in the backlog.
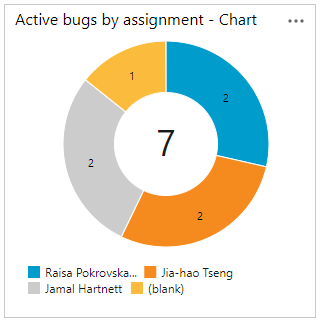
Active bugs: Track bug counts and set goals to keep them under a target number.
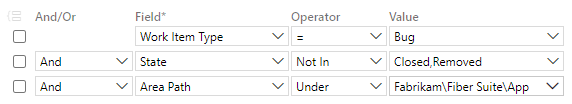
From this query, you can create a chart grouped by assignment or state.

Tagged work items: Track work tagged for specific goals, milestones, or categories.

Blocked work: Query for blocked items using a tag or custom field.

Example trend charts
Trend charts show how work item counts change over time. Configure them with a rolling time window (for example, 30 days).
Query focus
Query clauses and chart
Bug trends over time by state (last 30 days)

Active work trends by state (last 30 days)

Other useful widgets
These built-in dashboard widgets complement query charts for tracking progress: