Bemærk
Adgang til denne side kræver godkendelse. Du kan prøve at logge på eller ændre mapper.
Adgang til denne side kræver godkendelse. Du kan prøve at ændre mapper.
Time handling in Azure Stream Analytics is the set of mechanisms that determine how streaming events are timestamped, ordered, and processed based on when they occurred versus when they arrived. This article explains how to make design choices to solve practical time handling problems in Azure Stream Analytics jobs. Time handling design decisions are closely related to event ordering factors.
Background time concepts
To better frame the discussion, let's define some background concepts:
Event time: The time when the original event happens. For example, when a moving car on the highway approaches a toll booth.
Processing time: The time when the event reaches the processing system and is observed. For example, when a toll booth sensor sees the car and the computer system takes a few moments to process the data.
Watermark: An event time marker that indicates up to what point the streaming processor has ingested events. Watermarks let the system indicate clear progress on ingesting the events. By the nature of streams, the incoming event data never stops, so watermarks indicate the progress to a certain point in the stream.
The watermark concept is important. Watermarks allow Azure Stream Analytics to determine when the system can produce complete, correct, and repeatable results that don't need to be retracted. The processing can be done in a predictable and repeatable way. For example, if a recount needs to be done for some error handling condition, watermarks are safe starting and ending points.
For additional resources on this subject, see Tyler Akidau's blog posts Streaming 101 and Streaming 102.
Choose the best starting time
Azure Stream Analytics gives you two choices for picking event time: arrival time and application time.
Arrival time
Arrival time is assigned at the input source when the event reaches the source. You can access arrival time by using the EventEnqueuedUtcTime property for Event Hubs input, the IoTHub.EnqueuedTime property for IoT Hub input, and the BlobProperties.LastModified property for blob input.
Arrival time is used by default and is best used for data archiving scenarios where temporal logic isn't necessary.
Application time (also named Event Time)
Application time is assigned when the event is generated, and it's part of the event payload. To process events by application time, use the Timestamp by clause in the SELECT query. If Timestamp by is absent, events are processed by arrival time.
It's important to use a timestamp in the payload when temporal logic is involved to account for delays in the source system or in the network. The time assigned to an event is available in SYSTEM.TIMESTAMP.
How time progresses in Azure Stream Analytics
When you use application time, the time progression is based on the incoming events. It's difficult for the stream processing system to know if there are no events, or if events are delayed. For this reason, Azure Stream Analytics generates heuristic watermarks in the following ways for each input partition:
When there's any incoming event, the watermark is the largest event time Azure Stream Analytics has seen so far minus the out-of-order tolerance window size.
When there's no incoming event, the watermark is the current estimated arrival time minus the late arrival tolerance window. The estimated arrival time is the time that has elapsed from the last time an input event was seen plus that input event's arrival time.
The arrival time can only be estimated because the real arrival time is generated on the input event broker (such as Event Hubs or IoT Hub), not on the Azure Stream Analytics VM processing the events.
The design serves two additional purposes other than generating watermarks:
The system generates results in a timely fashion with or without incoming events.
You have control over how timely you want to see the output results. In the Azure portal, on the Event ordering page of your Stream Analytics job, you can configure the Out of order events setting. When you configure that setting, consider the trade-off of timeliness with tolerance of out-of-order events in the event stream.
The late arrival tolerance window is necessary to keep generating watermarks, even in the absence of incoming events. At times, there might be a period where no incoming events come in, like when an event input stream is sparse. That problem is exacerbated by the use of multiple partitions in the input event broker.
Streaming data processing systems without a late arrival tolerance window might suffer from delayed outputs when inputs are sparse and multiple partitions are used.
The system behavior needs to be repeatable. Repeatability is an important property of a streaming data processing system.
The watermark is derived from the arrival time and application time. Both are persisted in the event broker, and thus repeatable. When an arrival time is estimated in the absence of events, Azure Stream Analytics journals the estimated arrival time for repeatability during replay for failure recovery.
When you choose to use arrival time as the event time, you don't need to configure the out-of-order tolerance and late arrival tolerance. Because arrival time is guaranteed to be increasing in the input event broker, Azure Stream Analytics disregards the configurations.
Late arriving events
By definition of late arrival tolerance window, for each incoming event, Azure Stream Analytics compares the event time with the arrival time. If the event time is outside the tolerance window, you can configure the system to drop the event or adjust the event's time to be within the tolerance.
Once watermarks are generated, the service can potentially receive events with an event time lower than the watermark. You can configure the service to either drop those events, or adjust the event's time to the watermark value.
As a part of the adjustment, the event's System.Timestamp is set to the new value, but the event time field itself isn't changed. This adjustment is the only situation where an event's System.Timestamp can be different from the value in the event time field and might cause unexpected results to be generated.
Handle time variation with substreams
The heuristic watermark generation mechanism—where Azure Stream Analytics tracks event time progress using the largest observed timestamp minus the tolerance window—works well in most cases where time is mostly synchronized between the various event senders. However, in real life, especially in many IoT scenarios, the system has little control over the clock on the event senders. The event senders could be all sorts of IoT devices in the field, perhaps on different versions of device hardware and firmware.
Instead of using a watermark that is global to all events in an input partition, Azure Stream Analytics has another mechanism called substreams. You can use substreams in your job by writing a job query that uses the TIMESTAMP BY clause and the keyword OVER. To designate the substream, provide a key column name after the OVER keyword, such as a deviceid, so that system applies time policies by that column. Each substream gets its own independent watermark. This mechanism is useful to allow timely output generation, when dealing with large clock skews or network delays among event senders.
When you use substreams, Azure Stream Analytics applies the late arrival tolerance window to incoming events. The late arrival tolerance decides the maximum amount by which different substreams can be apart from each other. For example, if Device 1 is at Timestamp 1, and Device 2 is at Timestamp 2, the maximum late arrival tolerance is Timestamp 2 minus Timestamp 1. The default late arrival tolerance setting is 5 seconds, which is likely too small for IoT devices with divergent timestamps. Start with 5 minutes and make adjustments according to your device clock skew pattern.
Early arriving events
The early arrival window is a fixed 5-minute tolerance that determines how early an event can arrive relative to its event time before Azure Stream Analytics drops it. This window serves a different purpose from the late arrival tolerance window.
Because Azure Stream Analytics guarantees complete results, you can only specify job start time as the first output time of the job, not the input time. The job start time is required so that the system processes the complete window, not just from the middle of the window.
Azure Stream Analytics derives the start time from the query specification. However, because the input event broker is only indexed by arrival time, the system has to translate the starting event time to arrival time. The system can start processing events from that point in the input event broker. With the early arriving window limit, the translation is straightforward: starting event time minus the 5-minute early arriving window. This calculation also means that the system drops all events that are seen as having an event time 5 minutes earlier than the arrival time. The early input events metric is incremented when the events are dropped.
This concept ensures the processing is repeatable no matter where you start to output from. Without such a mechanism, it wouldn't be possible to guarantee repeatability, as many other streaming systems claim they do.
Side effects of event ordering time tolerances
Azure Stream Analytics jobs have several Event ordering options. Two can be configured in the Azure portal: the Out of order events setting (out-of-order tolerance), and the Events that arrive late setting (late arrival tolerance). The early arrival tolerance is fixed and can't be adjusted. Azure Stream Analytics uses these time policies to provide strong guarantees. However, these settings do have some sometimes unexpected implications:
Accidentally sending events that are too early.
Early events shouldn't normally be output. It's possible that early events are sent to the output if the sender's clock is running too fast. All early arriving events are dropped, so you won't see any of them from the output.
Sending old events to Event Hubs to be processed by Azure Stream Analytics.
Although old events might seem harmless at first, because of the application of the late arrival tolerance, the old events might be dropped. If the events are too old, the System.Timestamp value is altered during event ingestion. Because of this behavior, Azure Stream Analytics is better suited for near-real-time event processing scenarios than for historical event processing scenarios. You can set the Events that arrive late time to the largest possible value (20 days) to work around this behavior in some cases.
Outputs seem to be delayed.
The first watermark is generated at the calculated time: the maximum event time the system has observed so far, minus the out-of-order tolerance window size. By default, the out-of-order tolerance is configured to zero (00 minutes and 00 seconds). When you set it to a higher, non-zero time value, the streaming job's first output is delayed by that value of time (or greater) due to the first watermark time that is calculated.
Inputs are sparse.
When there's no input in a given partition, the watermark time is calculated as the arrival time minus the late arrival tolerance window. As a result, if input events are infrequent and sparse, the output can be delayed by that amount of time. The default Events that arrive late value is 5 seconds. You should expect to see some delay when sending input events one at a time, for example. The delays can get worse, when you set Events that arrive late window to a large value.
System.Timestamp value is different from the time in the event time field.
As described previously, the system adjusts event time by the out-of-order tolerance or late arrival tolerance windows. The System.Timestamp value of the event is adjusted, but the event time field isn't adjusted. You can use this to identify for which events the timestamps were adjusted. If the system changes the timestamp due to one of the tolerances, normally they're the same.
Metrics to observe
You can observe a number of the Event ordering time tolerance effects through Azure Stream Analytics job metrics. The following metrics are relevant:
| Metric | Description |
|---|---|
| Out-of-Order Events | Indicates the number of events received out of order that were either dropped or given an adjusted timestamp. This metric is directly impacted by the configuration of the Out of order events setting on the Event ordering page on the job in the Azure portal. |
| Late Input Events | Indicates the number of events arriving late from the source. This metric includes events that were dropped or had their timestamp adjusted. This metric is directly impacted by the configuration of the Events that arrive late setting in the Event ordering page on the job in the Azure portal. |
| Early Input Events | Indicates the number of events arriving early from the source that were either dropped or had their timestamp adjusted if they're beyond 5 minutes early. |
| Watermark Delay | Indicates the delay of the streaming data processing job. For more information, see the following section. |
Watermark delay details
Azure Stream Analytics computes the Watermark delay metric as the wall clock time of the processing node minus the largest watermark it has seen so far. For more information, see watermark delay.
There can be several reasons this metric value is larger than 0 under normal operation:
Inherent processing delay of the streaming pipeline. Normally this delay is nominal.
The out-of-order tolerance window introduced delay, because watermark is reduced by the size of the tolerance window.
The late arrival window introduced delay, because watermark is reduced by the size the tolerance window.
Clock skew of the processing node generating the metric.
There are several other resource constraints that can cause the streaming pipeline to slow down. The watermark delay metric can rise due to:
Not enough processing resources in Azure Stream Analytics to handle the volume of input events. To scale up resources, see Understand and adjust Streaming Units.
Not enough throughput within the input event brokers, so they're throttled. For possible solutions, see Automatically scale up Azure Event Hubs throughput units.
Output sinks (such as Azure SQL Database, Blob Storage, or Power BI) aren't provisioned with enough capacity, so they're throttled. The possible solutions vary widely based on the output service being used.
Output event frequency
Azure Stream Analytics uses watermark progress as the only trigger to produce output events. Because the watermark is derived from input data, it's repeatable during failure recovery and also in user-initiated reprocessing. When using windowed aggregates, the service only produces outputs at the end of the windows. In some cases, you might want to see partial aggregates generated from the windows. Partial aggregates aren't currently supported in Azure Stream Analytics.
In other streaming solutions, output events can be materialized at various trigger points, depending on external circumstances. It's possible in some solutions that the output events for a given time window can be generated multiple times. As the input values are refined, the aggregate results become more accurate. Events can be speculated at first, and revised over time. For example, when a certain device is offline from the network, an estimated value could be used by a system. Later on, the same device comes online to the network. Then the actual event data could be included in the input stream. The output results from processing that time window produces more accurate output.
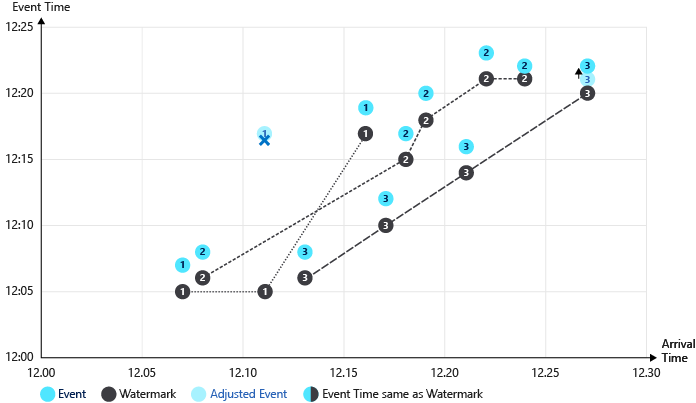
Illustrated example of watermarks
The following images illustrate how watermarks progress in different circumstances.
This table shows the example data that is charted below. Notice that the event time and the arrival time vary, sometimes matching and sometimes not.
| Event time | Arrival time | DeviceId |
|---|---|---|
| 12:07 | 12:07 | device1 |
| 12:08 | 12:08 | device2 |
| 12:17 | 12:11 | device1 |
| 12:08 | 12:13 | device3 |
| 12:19 | 12:16 | device1 |
| 12:12 | 12:17 | device3 |
| 12:17 | 12:18 | device2 |
| 12:20 | 12:19 | device2 |
| 12:16 | 12:21 | device3 |
| 12:23 | 12:22 | device2 |
| 12:22 | 12:24 | device2 |
| 12:21 | 12:27 | device3 |
In this illustration, the following tolerances are used:
- Early arrival window is 5 minutes
- Late arriving window is 5 minutes
- Reorder window is 2 minutes
Illustration of watermark progressing through these events:
Notable processes illustrated in the preceding graphic:
The first event (device1), and second event (device2) have aligned times and are processed without adjustments. The watermark progresses on each event.
When the third event (device1) is processed, the arrival time (12:11) precedes the event time (12:17). The event arrived 6 minutes early, so the event is dropped due to the 5-minute early arrival tolerance.
The watermark doesn't progress in this case of an early event.
The fourth event (device3), and fifth event (device1) have aligned times and are processed without adjustment. The watermark progresses on each event.
When the sixth event (device3) is processed, the arrival time (12:17) and the event time (12:12) are below the watermark level. The event time is adjusted to the watermark level (12:17).
When the twelfth event (device3) is processed, the arrival time (12:27) is 6 minutes ahead of the event time (12:21). The late arrival policy is applied. The event time is adjusted (12:22), which is above the watermark (12:21) so no further adjustment is applied.
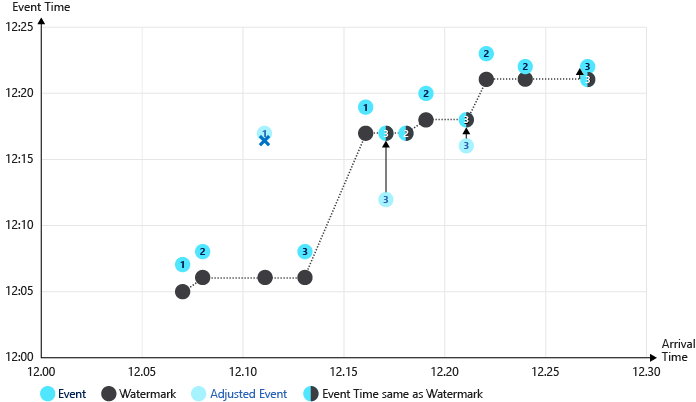
Second illustration of watermark progressing without an early arrival policy:
In this example, no early arrival policy is applied. Outlier events that arrive early raise the watermark significantly. Notice the third event (deviceId1 at time 12:11) isn't dropped in this scenario, and the watermark is raised to 12:15. The fourth event time is adjusted forward 7 minutes (12:08 to 12:15) as a result.
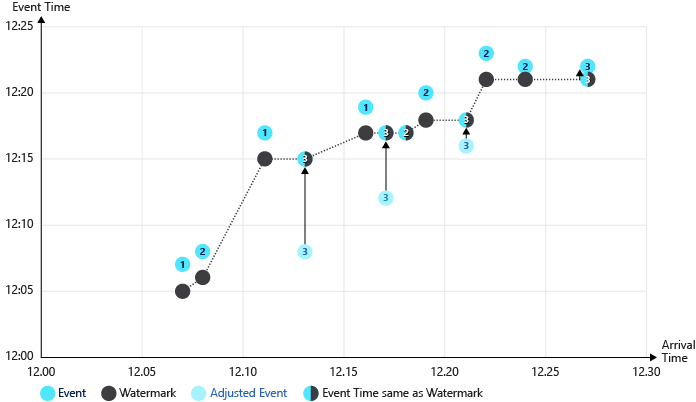
In the final illustration, substreams are used (OVER the DeviceId). Multiple watermarks are tracked, one per stream. There are fewer events with their times adjusted as a result.